Recent DShield SIEM Update
The last update to the DShield SIEM [4] was in Sep 2025 which contained some minor tweaks. This update currently is using ELK stack version 8.19.15, contains some additional dashboards and new logs.
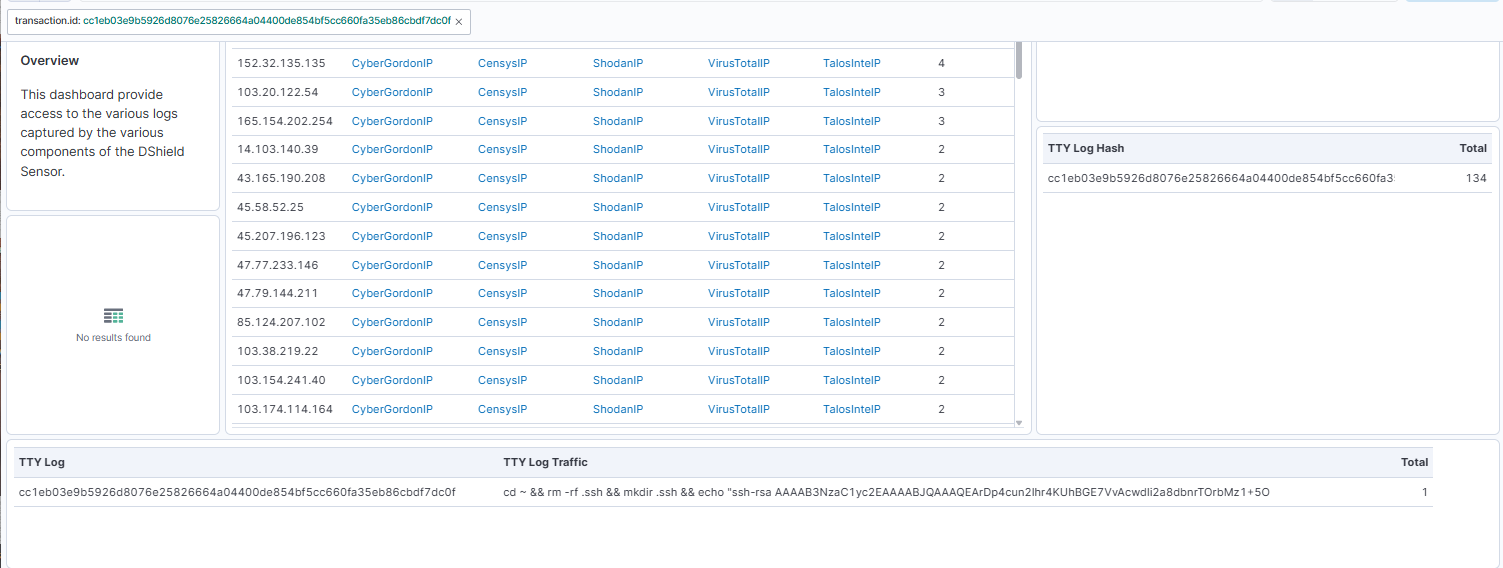
The following have been added to the DShield SIEM to provide additional information about what the DShield sensor [1] is receiving. These 2-addition installed in the DShield sensor provide direct collection of TTY logs [2] and Suricata [3] which are now reported to the DShield SIEM. The TTY logs are parsed and uploaded daily at 23:58Z which can be reviewed in the DShield - Traffic Analysis tab to match the TTY Log Hashes and shows which actor ran any series of commands while logged in the sensor.
The TTY logs are base64 encoded before they are sent to the SIEM and decoded by Kibana upon review. TTY logs in base64 format:
transaction.id: 021d88f11b09defc8756e1bd6eabaea8113b3fbf917c9bd4fef4f546a1c9512a
event.hash: ZWNobyAtZSAieCFcbjBPc0NsT21WU0JGOVxuME9zQ2xPbVZTQkY5InxwYXNzd2R8YmFzaC1iYXNoOiBFbnRlcjogY29tbWFuZCBub3QgZm91bmQK
transaction.id: 02caa940d3e30057af8235125c8376b2394622118344516895b045a6fe9b5ecb
event.hash: ZWNobyAtZSAiMTIzXG53QjV1clY4NXFxa1dcbndCNXVyVjg1cXFrVyJ8cGFzc3dkfGJhc2gtYmFzaDogRW50ZXI6IGNvbW1hbmQgbm90IGZvdW5kCg==
transaction.id: 052b36a73707754c7d49814cdc1f32fef3f72d334a7479f78f11c3229c1599d9
event.hash: ZWNobyAtZSAieCFcbkNLbGFOS0lOdWlYalxuQ0tsYU5LSU51aVhqInxwYXNzd2R8YmFzaC1iYXNoOiBFbnRlcjogY29tbWFuZCBub3QgZm91bmQK
The TTY logs are parsed once per day and uploaded directly into DShield SIEM with filebeat. The BASH script needs to be installed and configure according to the GitHub page [2] to provide a transcript of the activity reviewed in Kibana.
The addition of Suricata [3] is also available in the DShield dashboards and linked to all other logs.
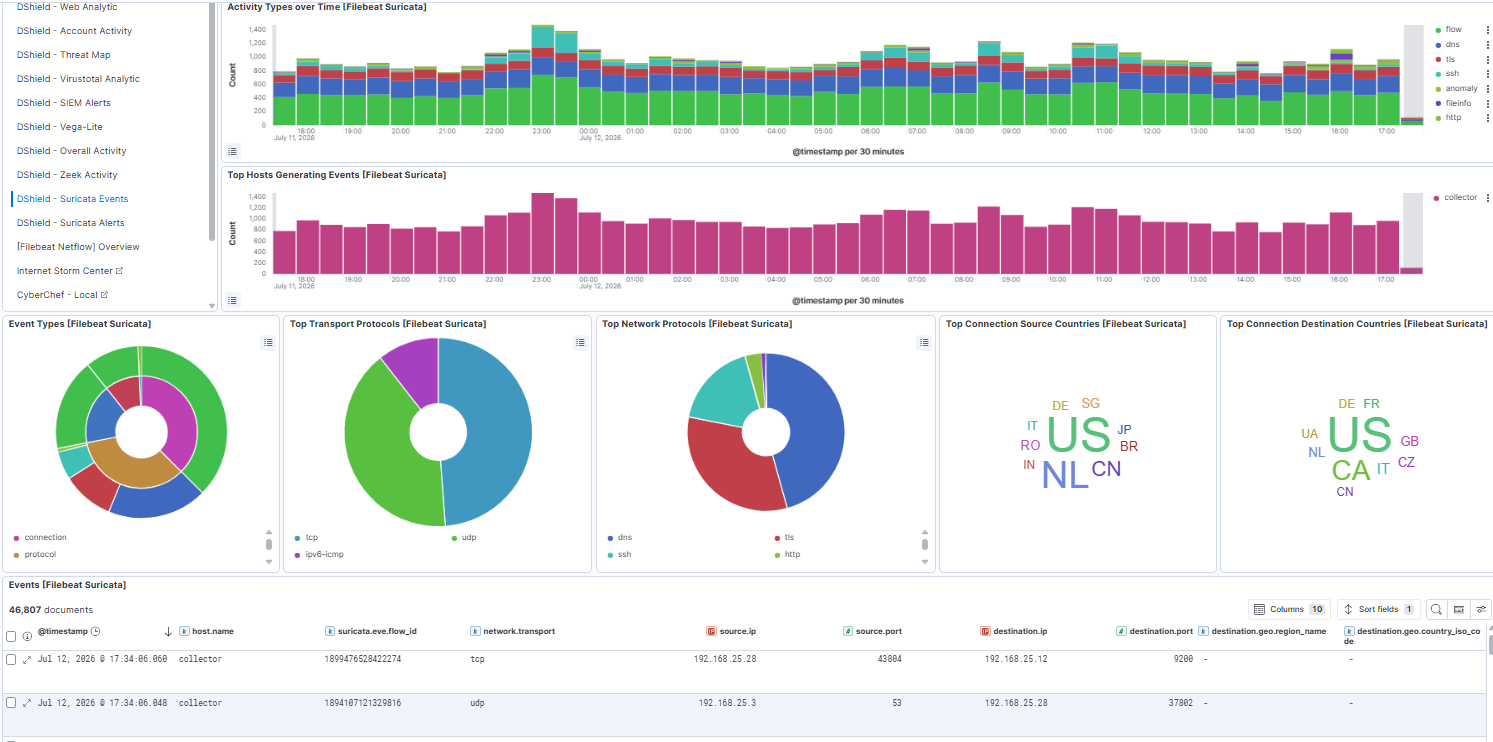
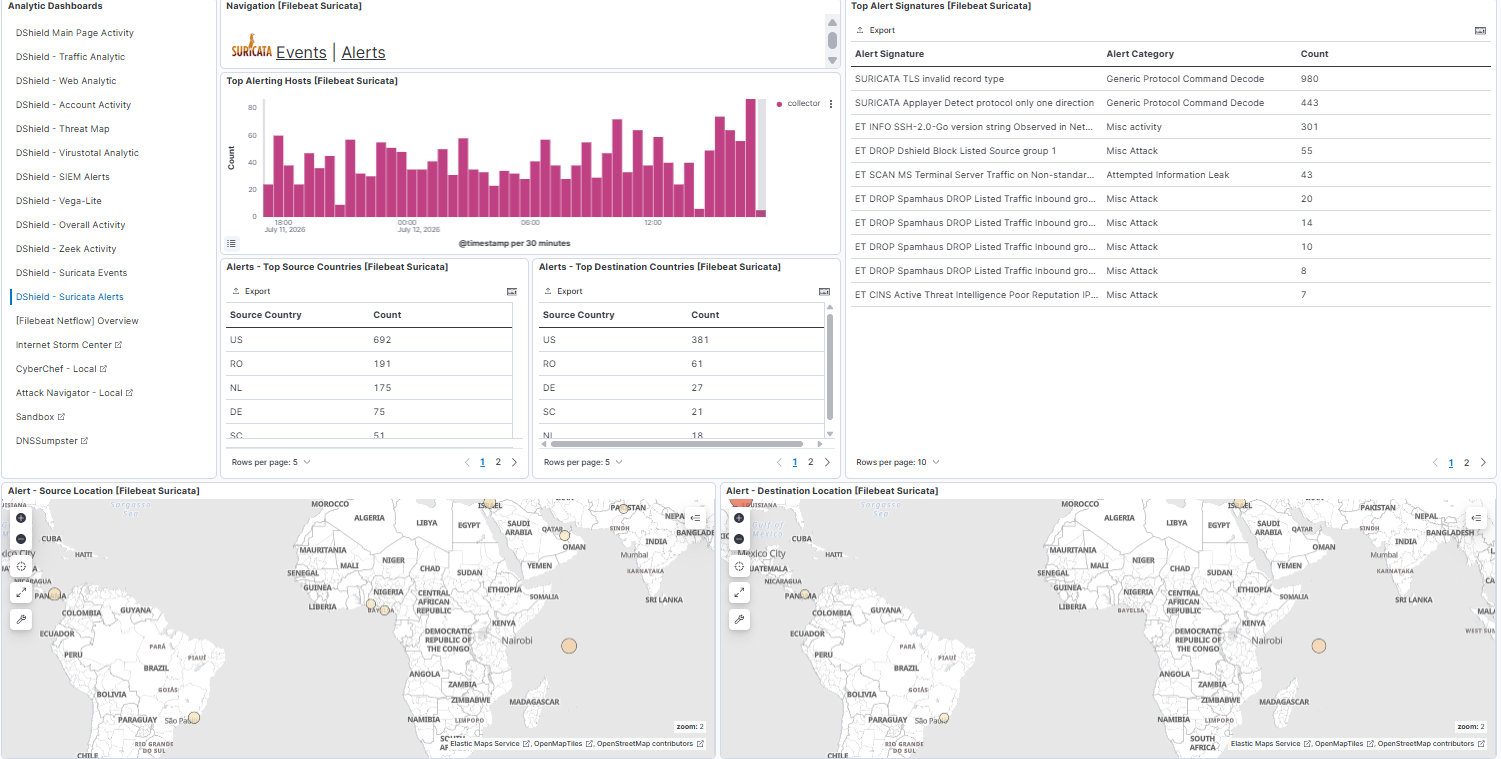
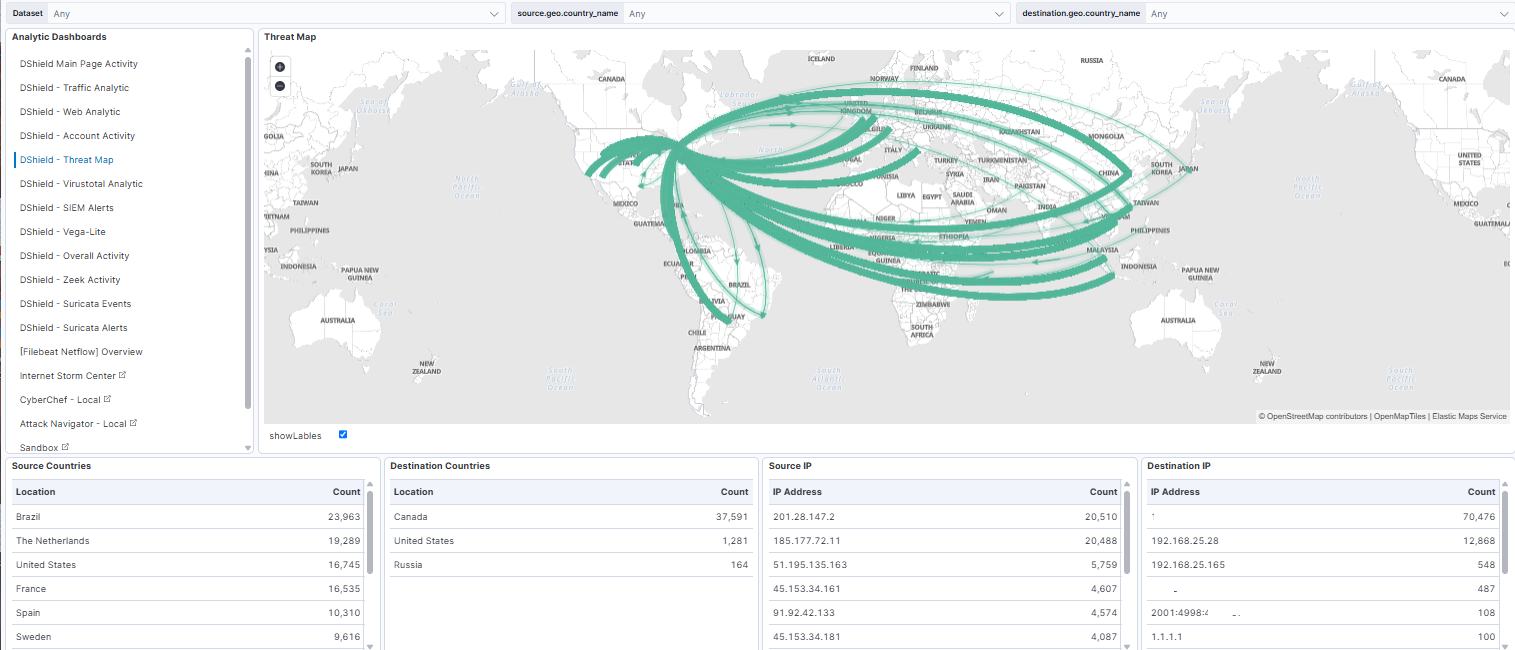
An updated dashboard now contains these changes to reflect the ability to share between sub-dashboard most of the queries selected (i.e. selecting an IP will replicate everywhere).
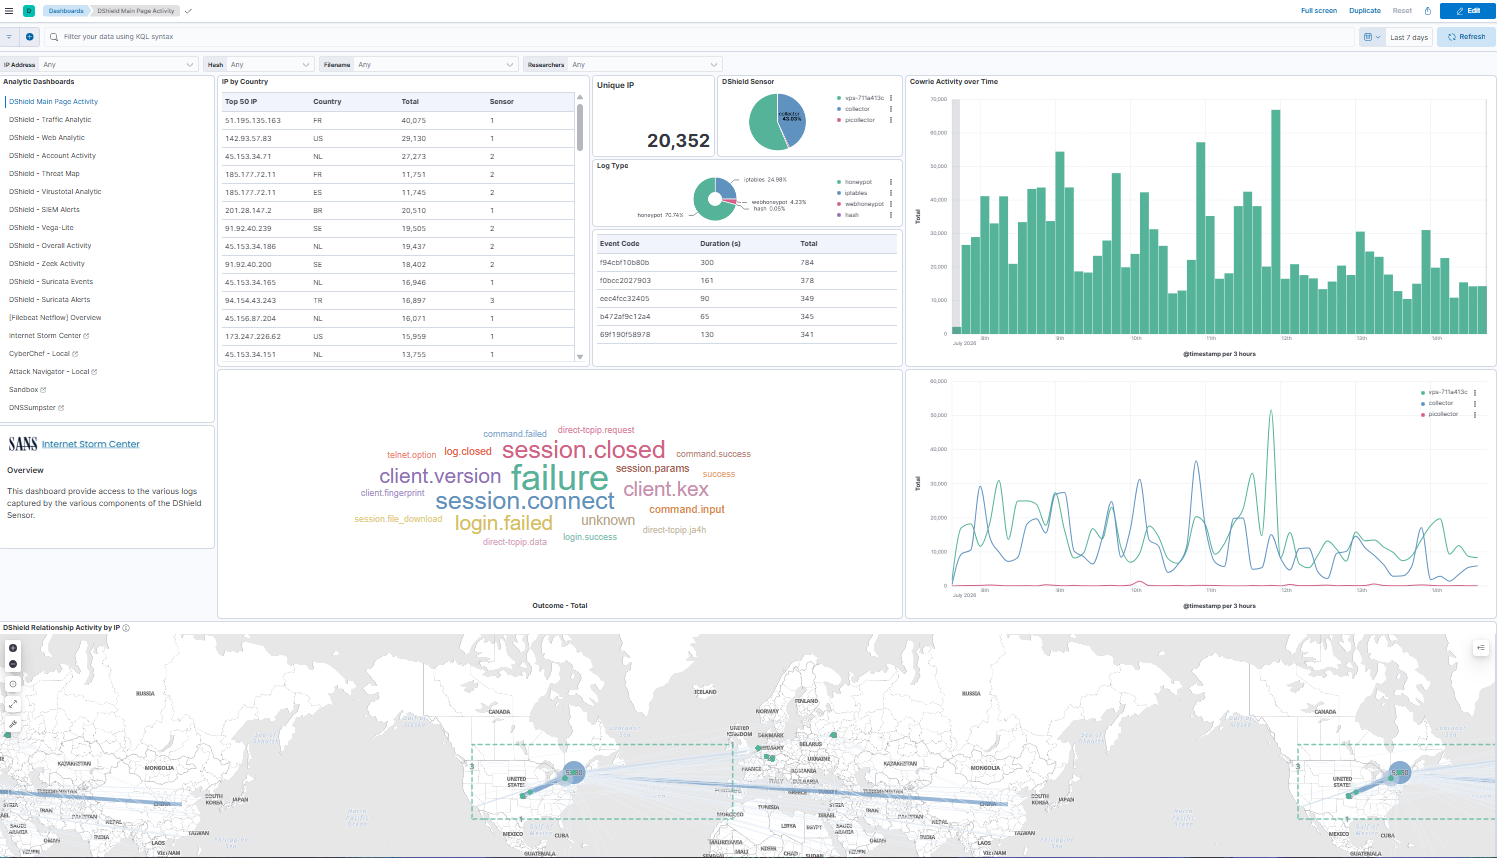
The dashboard also has a Threat Map that can be used to view the logs traffic activity in "movement".
Jesse and I are at SANSFIRE, if you are onsite, come tonight at the SANSFIRE 2026 Honeypot Workshop in Independence A - West (Level 5B) at 6:45 PM.
[1] https://isc.sans.edu/honeypot.html
[2] https://github.com/bruneaug/DShield-SIEM/blob/main/AddOn/TTYLogs_To_DShield-SIEM.md
[3] https://github.com/bruneaug/DShield-SIEM/blob/main/AddOn/Configure_Suricata.md
[4] https://isc.sans.edu/diary/DShield+SIEM+Docker+Updates/32276
[5] https://github.com/bruneaug/DShield-SIEM/tree/main
-----------
Guy Bruneau IPSS Inc.
My GitHub Page
Twitter: GuyBruneau
gbruneau at isc dot sans dot edu
Microsoft Patch Tuesday July 2026 - The AI Acopolypse is Here
This patch Tuesday includes a staggering 622 vulnerabilities, not including another 427 vulnerabilities in Chromium, affecting Microsoft's Edge browser. 62 of the vulnerabilities are rated critical. One was disclosed before today, and two have already been exploited.
Given the large number of vulnerabilities, it is difficult to point out "noteworthy" issues.
Already exploited vulnerabilities:
CVE-2026-56155 : Active Directory Federation Services Elevation of Privilege Vulnerability. This is an important (not critical) vulnerablity.
CVE-2026-56164: Microsoft SharePoint Server Elevation of Privilege Vulnerability. Microsoft considers this vulnerability's severity only moderate.
Disclosed but not yet exploited:
CVE-2026-50661: Windows BitLocker Security Feature Bypass Vulnerability. It is not clear right now if this is one of the Nightmare Eclipse vulnerabilities. "Anonymous" is credited with discovering the vulnerability.
Random Interesting Vulnerabilities:
CVE-2026-54128: Windows DHCP Client Remote Code Execution Vulnerability. A critical vulnerability, but it will require the victim to connect to a network exposed to a malicious DHCP server. Certainly interesting for "public wifi network" attacks. There are also a few critical DHCP server RCE vulnerabilities being addressed in this update.
CVE-2026-54982, CVE-2026-54995: Windows Reliable Multicast Transport Driver (RMCAST) Remote Code Execution Vulnerability. Two critical vulnerabilities. Just like DHCP, the exploit will typically require network-adjacent attackers. I have seen several similar vulnerabilities in MSFT updates in the past, but not seen exploits.
A quick word on how to deal with this flood of new vulnerabilities: You still own the same number of Microsoft products. Many products (Office..) are affected by a large number of vulnerabilities. Patching the product should not take a lot more time just because the patch addresses more vulnerabilities.
| Description | |||||||
|---|---|---|---|---|---|---|---|
| CVE | Disclosed | Exploited | Exploitability (old versions) | current version | Severity | CVSS Base (AVG) | CVSS Temporal (AVG) |
| .NET Denial of Service Vulnerability | |||||||
| %%cve:2026-47302%% | No | No | - | - | Important | 7.5 | 6.5 |
| %%cve:2026-50525%% | No | No | - | - | Important | 7.5 | 6.5 |
| %%cve:2026-50651%% | No | No | - | - | Important | 7.5 | 6.5 |
| %%cve:2026-57108%% | No | No | - | - | Important | 7.5 | 6.5 |
| .NET Framework Denial of Service Vulnerability | |||||||
| %%cve:2026-50524%% | No | No | - | - | Important | 7.5 | 6.5 |
| %%cve:2026-50527%% | No | No | - | - | Important | 7.5 | 6.5 |
| %%cve:2026-50648%% | No | No | - | - | Important | 7.5 | 6.5 |
| .NET Framework Elevation of Privilege Vulnerability | |||||||
| %%cve:2026-50650%% | No | No | - | - | Important | 7.8 | 6.8 |
| .NET Framework Remote Code Execution Vulnerability | |||||||
| %%cve:2026-50646%% | No | No | - | - | Important | 7.8 | 6.8 |
| .NET Remote Code Execution Vulnerability | |||||||
| %%cve:2026-50649%% | No | No | - | - | Important | 7.8 | 6.8 |
| .NET Security Feature Bypass Vulnerability | |||||||
| %%cve:2026-47304%% | No | No | - | - | Important | 8.1 | 7.1 |
| %%cve:2026-50528%% | No | No | - | - | Important | 8.2 | 7.1 |
| .NET Spoofing Vulnerability | |||||||
| %%cve:2026-50659%% | No | No | - | - | Important | 6.5 | 5.7 |
| .NET Tampering Vulnerability | |||||||
| %%cve:2026-50526%% | No | No | - | - | Important | 7.0 | 6.1 |
| ASP.NET Core Denial of Service Vulnerability | |||||||
| %%cve:2026-56170%% | No | No | - | - | Important | 7.5 | 6.5 |
| ASP.NET Core Elevation of Privilege Vulnerability | |||||||
| %%cve:2026-47300%% | No | No | - | - | Important | 8.8 | 7.7 |
| %%cve:2026-47303%% | No | No | - | - | Important | 8.8 | 7.7 |
| Active Directory Certificate Services Elevation of Privilege Vulnerability | |||||||
| %%cve:2026-54121%% | No | No | - | - | Critical | 8.8 | 7.7 |
| Active Directory Denial of Service Vulnerability | |||||||
| %%cve:2026-50682%% | No | No | - | - | Important | 7.1 | 6.2 |
| Active Directory Domain Services Elevation of Privilege Vulnerability | |||||||
| %%cve:2026-55001%% | No | No | - | - | Important | 7.8 | 6.8 |
| Active Directory Federation Server Denial of Service Vulnerability | |||||||
| %%cve:2026-50647%% | No | No | - | - | Important | 7.5 | 6.5 |
| Active Directory Federation Server Spoofing Vulnerability | |||||||
| %%cve:2026-50684%% | No | No | - | - | Important | 4.8 | 4.2 |
| Active Directory Federation Services Elevation of Privilege Vulnerability | |||||||
| %%cve:2026-56155%% | No | Yes | - | - | Important | 7.8 | 7.2 |
| Azure Active Directory Denial of Service Vulnerability | |||||||
| %%cve:2026-50652%% | No | No | - | - | Important | 7.5 | 6.5 |
| %%cve:2026-50653%% | No | No | - | - | Important | 7.5 | 6.5 |
| Azure CycleCloud Elevation of Privilege Vulnerability | |||||||
| %%cve:2026-57969%% | No | No | - | - | Important | 8.8 | 7.7 |
| %%cve:2026-58279%% | No | No | - | - | Important | 6.5 | 5.9 |
| Azure Monitor Agent Metrics Extension Elevation of Privilege Vulnerability | |||||||
| %%cve:2026-47632%% | No | No | - | - | Important | 8.8 | 7.7 |
| Azure OpenAI Elevation of Privilege Vulnerability (no customer action required) |
|||||||
| %%cve:2026-45499%% | No | No | - | - | Critical | 9.9 | 8.6 |
| Azure Spring Apps Elevation of Privilege Vulnerability | |||||||
| %%cve:2026-50338%% | No | No | - | - | Important | 8.2 | 7.4 |
| CVE-2026-13862 | |||||||
| %%cve:2026-13862%% | No | No | - | - | - | ||
| Clipboard User Service Elevation of Privilege Vulnerability | |||||||
| %%cve:2026-50488%% | No | No | - | - | Important | 7.8 | 6.8 |
| Code Integrity DLL (ci.dll) Elevation of Privilege Vulnerability | |||||||
| %%cve:2026-50491%% | No | No | - | - | Important | 7.0 | 6.1 |
| Composite Image File System driver (cimfs.sys) Information Disclosure Vulnerability | |||||||
| %%cve:2026-50381%% | No | No | - | - | Important | 5.5 | 4.8 |
| Content Delivery Manager Elevation of Privilege Vulnerability | |||||||
| %%cve:2026-50427%% | No | No | - | - | Important | 7.8 | 6.8 |
| DHCP Server Service Remote Code Execution Vulnerability | |||||||
| %%cve:2026-48564%% | No | No | - | - | Critical | 8.8 | 7.7 |
| %%cve:2026-50370%% | No | No | - | - | Critical | 8.8 | 7.7 |
| %%cve:2026-56159%% | No | No | - | - | Critical | 9.8 | 8.5 |
| DNS Client Tampering Vulnerability | |||||||
| %%cve:2026-49174%% | No | No | - | - | Important | 6.1 | 5.3 |
| %%cve:2026-50495%% | No | No | - | - | Important | 6.1 | 5.3 |
| Desktop Window Manager Elevation of Privilege Vulnerability | |||||||
| %%cve:2026-50692%% | No | No | - | - | Important | 8.8 | 7.7 |
| %%cve:2026-58633%% | No | No | - | - | Important | 7.8 | 6.8 |
| %%cve:2026-58634%% | No | No | - | - | Important | 7.8 | 6.8 |
| DirectX Graphics Kernel Elevation of Privilege Vulnerability | |||||||
| %%cve:2026-50296%% | No | No | - | - | Important | 7.0 | 6.1 |
| %%cve:2026-50375%% | No | No | - | - | Important | 6.3 | 5.5 |
| %%cve:2026-50353%% | No | No | - | - | Important | 7.8 | 6.8 |
| %%cve:2026-50493%% | No | No | - | - | Important | 7.8 | 6.8 |
| %%cve:2026-56643%% | No | No | - | - | Important | 7.8 | 6.8 |
| %%cve:2026-56644%% | No | No | - | - | Important | 7.8 | 6.8 |
| %%cve:2026-58629%% | No | No | - | - | Important | 7.0 | 6.1 |
| DirectX Graphics Kernel Remote Code Execution Vulnerability | |||||||
| %%cve:2026-50382%% | No | No | - | - | Critical | 8.8 | 7.7 |
| Extensible Storage Engine (ESENT) Elevation of Privilege Vulnerability | |||||||
| %%cve:2026-57088%% | No | No | - | - | Important | 7.8 | 6.8 |
| Game: Age of Empires II: Definitive Edition Remote Code Execution Vulnerability | |||||||
| %%cve:2026-50663%% | No | No | - | - | Important | 8.8 | 7.7 |
| GitHub Copilot Remote Code Execution Vulnerability | |||||||
| %%cve:2026-50510%% | No | No | - | - | Important | 7.8 | 6.8 |
| GitHub Copilot and Visual Studio Code Information Disclosure Vulnerability | |||||||
| %%cve:2026-47282%% | No | No | - | - | Important | 6.5 | 5.7 |
| GitHub Copilot and Visual Studio Code Security Feature Bypass Vulnerability | |||||||
| %%cve:2026-41109%% | No | No | - | - | Important | 8.8 | 7.7 |
| HTTP.sys Denial of Service Vulnerability | |||||||
| %%cve:2026-49787%% | No | No | - | - | Important | 7.5 | 6.5 |
| HTTP.sys Information Disclosure Vulnerability | |||||||
| %%cve:2026-50420%% | No | No | - | - | Important | 6.2 | 5.4 |
| HTTP/2 Denial of Service Vulnerability | |||||||
| %%cve:2026-49788%% | No | No | - | - | Important | 7.5 | 6.5 |
| Internet Key Exchange (IKE) Protocol Denial of Service Vulnerability | |||||||
| %%cve:2026-50696%% | No | No | - | - | Important | 7.5 | 6.5 |
| M365 Copilot for iOS Elevation of Privilege Vulnerability | |||||||
| %%cve:2026-58617%% | No | No | - | - | Important | 8.1 | 7.1 |
| Microsoft 365 Copilot Elevation of Privilege Vulnerability (no customer action required) |
|||||||
| %%cve:2026-41106%% | No | No | - | - | Critical | 9.3 | 8.1 |
| Microsoft Azure Synapse Elevation of Privilege Vulnerability (no customer action required) |
|||||||
| %%cve:2026-26145%% | No | No | - | - | Critical | 4.8 | 4.3 |
| Microsoft Bing App for IOS Spoofing Vulnerability | |||||||
| %%cve:2026-58595%% | No | No | - | - | Important | 8.1 | 7.1 |
| Microsoft Brokering File System Elevation of Privilege Vulnerability | |||||||
| %%cve:2026-49162%% | No | No | - | - | Important | 7.0 | 6.1 |
| %%cve:2026-50305%% | No | No | - | - | Important | 7.8 | 6.8 |
| %%cve:2026-50361%% | No | No | - | - | Important | 7.8 | 6.8 |
| %%cve:2026-50466%% | No | No | - | - | Important | 7.8 | 6.8 |
| %%cve:2026-50458%% | No | No | - | - | Important | 7.8 | 6.8 |
| Microsoft Copilot Remote Code Execution Vulnerability | |||||||
| %%cve:2026-48561%% | No | No | - | - | Critical | 9.6 | 8.3 |
| Microsoft DWM Core Library Elevation of Privilege Vulnerability | |||||||
| %%cve:2026-50329%% | No | No | - | - | Important | 7.8 | 6.8 |
| %%cve:2026-58541%% | No | No | - | - | Important | 7.8 | 6.8 |
| Microsoft Defender Remote Code Execution Vulnerability | |||||||
| %%cve:2026-55011%% | No | No | - | - | Critical | 7.8 | 6.8 |
| %%cve:2026-55012%% | No | No | - | - | Critical | 7.8 | 6.8 |
| Microsoft Defender for Endpoint for Mac Elevation of Privilege Vulnerability | |||||||
| %%cve:2026-50658%% | No | No | - | - | Important | 7.0 | 6.1 |
| %%cve:2026-56178%% | No | No | - | - | Important | 5.5 | 4.8 |
| Microsoft Defender for Endpoint for Mac Information Disclosure Vulnerability | |||||||
| %%cve:2026-50657%% | No | No | - | - | Important | 4.7 | 4.1 |
| Microsoft Dynamics NAV and Microsoft Dynamics 365 Business Central (On Premises) Remote Code Execution Vulnerability | |||||||
| %%cve:2026-55944%% | No | No | - | - | Critical | 9.8 | 8.5 |
| Microsoft Edge (Chromium-based) Elevation of Privilege Vulnerability | |||||||
| %%cve:2026-58596%% | No | No | - | - | Important | 8.3 | 7.2 |
| Microsoft Edge (Chromium-based) Information Disclosure Vulnerability | |||||||
| %%cve:2026-55945%% | No | No | - | - | Moderate | 4.2 | 3.7 |
| %%cve:2026-57991%% | No | No | - | - | Important | 7.4 | 6.4 |
| %%cve:2026-58291%% | No | No | - | - | Important | 6.1 | 5.3 |
| Microsoft Edge (Chromium-based) Remote Code Execution Vulnerability | |||||||
| %%cve:2026-57981%% | No | No | - | - | Important | 8.8 | 7.7 |
| %%cve:2026-57984%% | No | No | - | - | Important | 7.5 | 6.5 |
| %%cve:2026-57985%% | No | No | - | - | Important | 7.6 | 6.6 |
| %%cve:2026-57986%% | No | No | - | - | Important | 7.5 | 6.5 |
| %%cve:2026-57988%% | No | No | - | - | Important | 7.1 | 6.2 |
| %%cve:2026-57992%% | No | No | - | - | Important | 7.5 | 6.5 |
| %%cve:2026-58276%% | No | No | - | - | Important | 7.5 | 6.5 |
| %%cve:2026-56645%% | No | No | - | - | Important | 8.8 | 7.7 |
| %%cve:2026-57974%% | No | No | - | - | Important | 8.8 | 7.7 |
| %%cve:2026-57975%% | No | No | - | - | Important | 7.5 | 6.5 |
| %%cve:2026-58281%% | No | No | - | - | Important | 8.3 | 7.2 |
| %%cve:2026-58284%% | No | No | - | - | Important | 8.3 | 7.2 |
| %%cve:2026-58285%% | No | No | - | - | Important | 8.3 | 7.2 |
| %%cve:2026-58287%% | No | No | - | - | Important | 8.3 | 7.2 |
| %%cve:2026-58288%% | No | No | - | - | Important | 8.3 | 7.2 |
| %%cve:2026-58289%% | No | No | - | - | Important | 9.0 | 7.8 |
| %%cve:2026-58290%% | No | No | - | - | Important | 7.5 | 6.5 |
| %%cve:2026-58292%% | No | No | - | - | Important | 7.5 | 6.5 |
| %%cve:2026-58293%% | No | No | - | - | Important | 8.1 | 7.1 |
| %%cve:2026-58294%% | No | No | - | - | Important | 7.5 | 6.5 |
| Microsoft Edge (Chromium-based) Security Feature Bypass Vulnerability | |||||||
| %%cve:2026-57983%% | No | No | - | - | Important | 8.7 | 7.6 |
| %%cve:2026-58295%% | No | No | - | - | Important | 8.3 | 7.2 |
| %%cve:2026-58525%% | No | No | - | - | Important | 8.2 | 7.1 |
| Microsoft Edge (Chromium-based) Spoofing Vulnerability | |||||||
| %%cve:2026-45488%% | No | No | - | - | Moderate | 5.4 | 4.7 |
| %%cve:2026-45489%% | No | No | - | - | Moderate | 6.5 | 5.7 |
| %%cve:2026-57987%% | No | No | - | - | Important | 6.5 | 5.7 |
| %%cve:2026-58278%% | No | No | - | - | Important | 5.4 | 4.7 |
| %%cve:2026-56646%% | No | No | - | - | Important | 6.5 | 5.7 |
| %%cve:2026-57977%% | No | No | - | - | Important | 7.1 | 6.2 |
| %%cve:2026-57993%% | No | No | - | - | Important | 7.4 | 6.4 |
| %%cve:2026-58282%% | No | No | - | - | Important | 8.1 | 7.1 |
| %%cve:2026-58283%% | No | No | - | - | Important | 8.1 | 7.1 |
| %%cve:2026-58286%% | No | No | - | - | Important | 8.1 | 7.1 |
| %%cve:2026-58298%% | No | No | - | - | Important | 7.2 | 6.3 |
| %%cve:2026-58524%% | No | No | - | - | Important | 5.4 | 4.7 |
| %%cve:2026-58597%% | No | No | - | - | Low | 4.3 | 3.8 |
| Microsoft Edge for Android Information Disclosure Vulnerability | |||||||
| %%cve:2026-58296%% | No | No | - | - | Important | 7.1 | 6.2 |
| %%cve:2026-58297%% | No | No | - | - | Important | 7.1 | 6.2 |
| %%cve:2026-58300%% | No | No | - | - | Important | 6.2 | 5.4 |
| %%cve:2026-58522%% | No | No | - | - | Important | 6.8 | 5.9 |
| Microsoft Edge for Android Remote Code Execution Vulnerability | |||||||
| %%cve:2026-58299%% | No | No | - | - | Important | 7.5 | 6.5 |
| Microsoft Edge for Android Security Feature Bypass Vulnerability | |||||||
| %%cve:2026-58523%% | No | No | - | - | Important | 6.5 | 5.7 |
| Microsoft Entra Provisioning Service Elevation of Privilege Vulnerability (no customer action required) |
|||||||
| %%cve:2026-57100%% | No | No | - | - | Critical | 9.9 | 8.6 |
| Microsoft Excel Information Disclosure Vulnerability | |||||||
| %%cve:2026-50678%% | No | No | - | - | Important | 6.6 | 5.8 |
| %%cve:2026-54988%% | No | No | - | - | Important | 6.1 | 5.3 |
| %%cve:2026-48580%% | No | No | - | - | Important | 5.5 | 4.8 |
| %%cve:2026-50408%% | No | No | - | - | Important | 5.5 | 4.8 |
| %%cve:2026-55046%% | No | No | - | - | Important | 5.5 | 4.8 |
| %%cve:2026-55138%% | No | No | - | - | Important | 5.5 | 4.8 |
| %%cve:2026-55054%% | No | No | - | - | Important | 6.5 | 5.7 |
| %%cve:2026-55122%% | No | No | - | - | Important | 7.1 | 6.2 |
| %%cve:2026-55898%% | No | No | - | - | Important | 6.1 | 5.3 |
| Microsoft Excel Remote Code Execution Vulnerability | |||||||
| %%cve:2026-50675%% | No | No | - | - | Important | 7.8 | 6.8 |
| %%cve:2026-55899%% | No | No | - | - | Important | 7.8 | 6.8 |
| %%cve:2026-55948%% | No | No | - | - | Important | 7.8 | 6.8 |
| %%cve:2026-58618%% | No | No | - | - | Important | 7.8 | 6.8 |
| %%cve:2026-47642%% | No | No | - | - | Important | 7.8 | 6.8 |
| %%cve:2026-55024%% | No | No | - | - | Important | 7.8 | 6.8 |
| %%cve:2026-55025%% | No | No | - | - | Important | 7.8 | 6.8 |
| %%cve:2026-55031%% | No | No | - | - | Important | 7.8 | 6.8 |
| %%cve:2026-55048%% | No | No | - | - | Important | 7.8 | 6.8 |
| %%cve:2026-55029%% | No | No | - | - | Important | 7.8 | 6.8 |
| %%cve:2026-55039%% | No | No | - | - | Important | 7.8 | 6.8 |
| %%cve:2026-55041%% | No | No | - | - | Important | 7.8 | 6.8 |
| %%cve:2026-55136%% | No | No | - | - | Important | 7.8 | 6.8 |
| %%cve:2026-55141%% | No | No | - | - | Important | 7.8 | 6.8 |
| %%cve:2026-55036%% | No | No | - | - | Important | 7.8 | 6.8 |
| %%cve:2026-55044%% | No | No | - | - | Important | 7.8 | 6.8 |
| %%cve:2026-55037%% | No | No | - | - | Important | 7.8 | 6.8 |
| %%cve:2026-55058%% | No | No | - | - | Important | 7.8 | 6.8 |
| %%cve:2026-55137%% | No | No | - | - | Important | 7.8 | 6.8 |
| %%cve:2026-55053%% | No | No | - | - | Important | 7.8 | 6.8 |
| %%cve:2026-55131%% | No | No | - | - | Important | 7.8 | 6.8 |
| %%cve:2026-54131%% | No | No | - | - | Important | 7.8 | 6.8 |
| %%cve:2026-55947%% | No | No | - | - | Important | 7.8 | 6.8 |
| %%cve:2026-55949%% | No | No | - | - | Important | 7.8 | 6.8 |
| %%cve:2026-56156%% | No | No | - | - | Important | 7.8 | 6.8 |
| Microsoft Exchange Online Elevation of Privilege Vulnerability (no customer action required) |
|||||||
| %%cve:2026-54998%% | No | No | - | - | Critical | 8.8 | 7.7 |
| Microsoft Exchange Server Elevation of Privilege Vulnerability | |||||||
| %%cve:2026-55006%% | No | No | - | - | Important | 7.8 | 6.8 |
| %%cve:2026-55009%% | No | No | - | - | Important | 7.8 | 6.8 |
| Microsoft Exchange Server Remote Code Execution Vulnerability | |||||||
| %%cve:2026-55005%% | No | No | - | - | Important | 8.8 | 7.7 |
| Microsoft Exchange Server Spoofing Vulnerability | |||||||
| %%cve:2026-55008%% | No | No | - | - | Critical | 9.6 | 8.3 |
| Microsoft Fabric Data Warehouse Remote Code Execution Vulnerability | |||||||
| %%cve:2026-56642%% | No | No | - | - | Important | 8.8 | 7.7 |
| Microsoft Install Service Elevation of Privilege Vulnerability | |||||||
| %%cve:2026-50343%% | No | No | - | - | Important | 7.8 | 6.8 |
| Microsoft Message Queuing Queue Manager Remote Code Execution Vulnerability | |||||||
| %%cve:2026-54992%% | No | No | - | - | Critical | 8.4 | 7.3 |
| %%cve:2026-50439%% | No | No | - | - | Important | 8.1 | 7.1 |
| Microsoft NAT Helper Components (ipnathlp.dll) Elevation of Privilege Vulnerability | |||||||
| %%cve:2026-58537%% | No | No | - | - | Important | 7.8 | 6.8 |
| Microsoft Office Information Disclosure Vulnerability | |||||||
| %%cve:2026-56193%% | No | No | - | - | Important | 7.1 | 6.2 |
| %%cve:2026-55023%% | No | No | - | - | Important | 5.5 | 4.8 |
| %%cve:2026-55026%% | No | No | - | - | Important | 6.2 | 5.4 |
| %%cve:2026-55027%% | No | No | - | - | Important | 5.5 | 4.8 |
| %%cve:2026-55028%% | No | No | - | - | Important | 5.5 | 4.8 |
| %%cve:2026-55047%% | No | No | - | - | Important | 5.5 | 4.8 |
| %%cve:2026-55035%% | No | No | - | - | Important | 5.5 | 4.8 |
| %%cve:2026-55057%% | No | No | - | - | Important | 5.5 | 4.8 |
| %%cve:2026-55042%% | No | No | - | - | Important | 5.5 | 4.8 |
| %%cve:2026-55139%% | No | No | - | - | Important | 5.5 | 4.8 |
| %%cve:2026-50665%% | No | No | - | - | Important | 7.8 | 6.8 |
| %%cve:2026-56192%% | No | No | - | - | Important | 5.5 | 4.8 |
| %%cve:2026-56195%% | No | No | - | - | Important | 5.5 | 4.8 |
| %%cve:2026-55121%% | No | No | - | - | Important | 5.5 | 4.8 |
| Microsoft Office Remote Code Execution Vulnerability | |||||||
| %%cve:2026-47290%% | No | No | - | - | Important | 7.8 | 6.8 |
| %%cve:2026-50301%% | No | No | - | - | Important | 7.8 | 6.8 |
| %%cve:2026-50314%% | No | No | - | - | Critical | 7.8 | 6.8 |
| %%cve:2026-50467%% | No | No | - | - | Critical | 7.8 | 6.8 |
| %%cve:2026-55017%% | No | No | - | - | Important | 7.8 | 6.8 |
| %%cve:2026-55018%% | No | No | - | - | Critical | 7.8 | 6.8 |
| %%cve:2026-55022%% | No | No | - | - | Critical | 7.8 | 6.8 |
| %%cve:2026-55125%% | No | No | - | - | Important | 7.8 | 6.8 |
| %%cve:2026-55045%% | No | No | - | - | Critical | 8.4 | 7.3 |
| %%cve:2026-55049%% | No | No | - | - | Critical | 7.8 | 6.8 |
| %%cve:2026-55129%% | No | No | - | - | Critical | 7.8 | 6.8 |
| %%cve:2026-55056%% | No | No | - | - | Critical | 7.8 | 6.8 |
| %%cve:2026-55140%% | No | No | - | - | Critical | 7.8 | 6.8 |
| Microsoft OneNote Remote Code Execution Vulnerability | |||||||
| %%cve:2026-55133%% | No | No | - | - | Important | 7.8 | 6.8 |
| Microsoft PC Manager Elevation of Privilege Vulnerability | |||||||
| %%cve:2026-58636%% | No | No | - | - | Important | 7.8 | 6.8 |
| %%cve:2026-50438%% | No | No | - | - | Important | 8.8 | 7.7 |
| Microsoft PowerBI Report Server Spoofing Vulnerability | |||||||
| %%cve:2026-58647%% | No | No | - | - | Important | 8.0 | 7.0 |
| Microsoft PowerPoint Remote Code Execution Vulnerability | |||||||
| %%cve:2026-55043%% | No | No | - | - | Critical | 7.8 | 6.8 |
| %%cve:2026-55123%% | No | No | - | - | Critical | 7.8 | 6.8 |
| %%cve:2026-55120%% | No | No | - | - | Critical | 7.8 | 6.8 |
| Microsoft SQL Server Elevation of Privilege Vulnerability | |||||||
| %%cve:2026-47296%% | No | No | - | - | Important | 7.8 | 6.8 |
| %%cve:2026-55002%% | No | No | - | - | Important | 7.8 | 6.8 |
| %%cve:2026-47295%% | No | No | - | - | Important | 8.8 | 7.7 |
| Microsoft SQL Server Information Disclosure Vulnerability | |||||||
| %%cve:2026-50468%% | No | No | - | - | Important | 6.5 | 5.7 |
| %%cve:2026-54116%% | No | No | - | - | Important | 6.5 | 5.7 |
| Microsoft SQL Server Remote Code Execution Vulnerability | |||||||
| %%cve:2026-54117%% | No | No | - | - | Critical | 8.8 | 7.7 |
| %%cve:2026-54118%% | No | No | - | - | Critical | 8.8 | 7.7 |
| Microsoft SharePoint Elevation of Privilege Vulnerability | |||||||
| %%cve:2026-55052%% | No | No | - | - | Important | 8.8 | 7.7 |
| %%cve:2026-58277%% | No | No | - | - | Important | 8.8 | 7.7 |
| Microsoft SharePoint Remote Code Execution Vulnerability | |||||||
| %%cve:2026-50522%% | No | No | - | - | Critical | 9.8 | 8.5 |
| %%cve:2026-58644%% | No | No | - | - | Critical | 9.8 | 8.5 |
| Microsoft SharePoint Server Elevation of Privilege Vulnerability | |||||||
| %%cve:2026-56164%% | No | Yes | - | - | Moderate | 5.3 | 4.9 |
| Microsoft SharePoint Server Information Disclosure Vulnerability | |||||||
| %%cve:2026-55051%% | No | No | - | - | Important | 6.5 | 5.7 |
| Microsoft SharePoint Server Security Feature Bypass Vulnerability | |||||||
| %%cve:2026-55040%% | No | No | - | - | Critical | 9.1 | 7.9 |
| Microsoft SharePoint Server Spoofing Vulnerability | |||||||
| %%cve:2026-54108%% | No | No | - | - | Important | 6.5 | 5.7 |
| %%cve:2026-55016%% | No | No | - | - | Important | 4.6 | 4.0 |
| %%cve:2026-55019%% | No | No | - | - | Important | 4.6 | 4.0 |
| %%cve:2026-55020%% | No | No | - | - | Important | 4.6 | 4.0 |
| %%cve:2026-55021%% | No | No | - | - | Important | 7.3 | 6.4 |
| %%cve:2026-55030%% | No | No | - | - | Important | 4.6 | 4.0 |
| %%cve:2026-55034%% | No | No | - | - | Important | 7.3 | 6.4 |
| %%cve:2026-55126%% | No | No | - | - | Important | 7.3 | 6.4 |
| %%cve:2026-55135%% | No | No | - | - | Important | 4.6 | 4.0 |
| %%cve:2026-56157%% | No | No | - | - | Important | 5.4 | 4.7 |
| Microsoft Windows App Store Elevation of Privilege Vulnerability | |||||||
| %%cve:2026-42900%% | No | No | - | - | Important | 8.1 | 7.1 |
| %%cve:2026-49784%% | No | No | - | - | Important | 7.0 | 6.1 |
| %%cve:2026-50356%% | No | No | - | - | Important | 7.0 | 6.1 |
| Microsoft Windows App Store Information Disclosure Vulnerability | |||||||
| %%cve:2026-49165%% | No | No | - | - | Important | 7.1 | 6.2 |
| Microsoft Windows Media Foundation Remote Code Execution Vulnerability | |||||||
| %%cve:2026-54993%% | No | No | - | - | Important | 7.8 | 6.8 |
| %%cve:2026-58610%% | No | No | - | - | Important | 7.8 | 6.8 |
| %%cve:2026-50655%% | No | No | - | - | Critical | 7.8 | 6.8 |
| %%cve:2026-56189%% | No | No | - | - | Critical | 7.8 | 6.8 |
| %%cve:2026-57090%% | No | No | - | - | Critical | 8.8 | 7.7 |
| %%cve:2026-57094%% | No | No | - | - | Critical | 8.8 | 7.7 |
| %%cve:2026-57087%% | No | No | - | - | Critical | 8.8 | 7.7 |
| Microsoft Windows VMSwitch Elevation of Privilege Vulnerability | |||||||
| %%cve:2026-57092%% | No | No | - | - | Critical | 9.9 | 8.6 |
| Microsoft Word Information Disclosure Vulnerability | |||||||
| %%cve:2026-55050%% | No | No | - | - | Important | 5.5 | 4.8 |
| %%cve:2026-55124%% | No | No | - | - | Important | 5.5 | 4.8 |
| %%cve:2026-55142%% | No | No | - | - | Important | 5.5 | 4.8 |
| Microsoft Word Remote Code Execution Vulnerability | |||||||
| %%cve:2026-55032%% | No | No | - | - | Important | 7.8 | 6.8 |
| %%cve:2026-55033%% | No | No | - | - | Critical | 7.8 | 6.8 |
| %%cve:2026-55127%% | No | No | - | - | Critical | 7.8 | 6.8 |
| %%cve:2026-55055%% | No | No | - | - | Important | 7.8 | 6.8 |
| %%cve:2026-55038%% | No | No | - | - | Important | 7.8 | 6.8 |
| %%cve:2026-55132%% | No | No | - | - | Critical | 7.8 | 6.8 |
| %%cve:2026-55134%% | No | No | - | - | Important | 7.8 | 6.8 |
| %%cve:2026-55128%% | No | No | - | - | Important | 7.8 | 6.8 |
| %%cve:2026-55130%% | No | No | - | - | Important | 7.8 | 6.8 |
| Microsoft XML Core Services Elevation of Privilege Vulnerability | |||||||
| %%cve:2026-50359%% | No | No | - | - | Important | 7.0 | 6.1 |
| Microsoft XML Security Feature Bypass Vulnerability | |||||||
| %%cve:2026-57097%% | No | No | - | - | Important | 6.4 | 5.6 |
| Minecraft Bedrock Dedicated Server Remote Code Execution Vulnerability (no customer action required) |
|||||||
| %%cve:2026-55010%% | No | No | - | - | Critical | 9.8 | 8.5 |
| NTFS Elevation of Privilege Vulnerability | |||||||
| %%cve:2026-50402%% | No | No | - | - | Important | 7.8 | 6.8 |
| Netlogon RPC Elevation of Privilege Vulnerability | |||||||
| %%cve:2026-50346%% | No | No | - | - | Important | 7.8 | 6.8 |
| OData for ASP.NET and ASP.NET Core Denial of Service Vulnerability | |||||||
| %%cve:2026-50506%% | No | No | - | - | Important | 7.5 | 6.5 |
| %%cve:2026-45646%% | No | No | - | - | Important | 7.5 | 6.5 |
| Outlook Copilot Tampering Vulnerability | |||||||
| %%cve:2026-55145%% | No | No | - | - | Moderate | 6.3 | 5.7 |
| Quality Windows Audio/Video Experience (QWAVE) Elevation of Privilege Vulnerability | |||||||
| %%cve:2026-54989%% | No | No | - | - | Important | 7.0 | 6.1 |
| Remote Access Management service/API (RPC server) Elevation of Privilege Vulnerability | |||||||
| %%cve:2026-50365%% | No | No | - | - | Important | 8.0 | 7.0 |
| Remote Desktop Client Remote Code Execution Vulnerability | |||||||
| %%cve:2026-54990%% | No | No | - | - | Important | 9.8 | 8.5 |
| %%cve:2026-50474%% | No | No | - | - | Critical | 8.8 | 7.7 |
| %%cve:2026-58594%% | No | No | - | - | Important | 8.8 | 7.7 |
| Remote Desktop Protocol Remote Code Execution Vulnerability | |||||||
| %%cve:2026-56190%% | No | No | - | - | Important | 9.8 | 8.5 |
| SQL Server ODBC driver Elevation of Privilege Vulnerability | |||||||
| %%cve:2026-42990%% | No | No | - | - | Important | 9.8 | 8.5 |
| Secure Boot Security Feature Bypass Vulnerability | |||||||
| %%cve:2026-49783%% | No | No | - | - | Important | 7.8 | 6.8 |
| Storage Spaces Direct Elevation of Privilege Vulnerability | |||||||
| %%cve:2026-49168%% | No | No | - | - | Important | 6.8 | 5.9 |
| Surface Broker SDMA Elevation of Privilege Vulnerability | |||||||
| %%cve:2026-48581%% | No | No | - | - | Important | 7.8 | 6.8 |
| Universal Plug and Play (upnp.dll) Information Disclosure Vulnerability | |||||||
| %%cve:2026-49180%% | No | No | - | - | Important | 5.5 | 4.8 |
| %%cve:2026-50455%% | No | No | - | - | Important | 5.5 | 4.8 |
| Universal Print Management Service Elevation of Privilege Vulnerability | |||||||
| %%cve:2026-54111%% | No | No | - | - | Important | 7.0 | 6.1 |
| %%cve:2026-58543%% | No | No | - | - | Important | 6.3 | 5.5 |
| Virtual Hard Disk (VHD) Miniport Driver Elevation of Privilege Vulernability | |||||||
| %%cve:2026-58601%% | No | No | - | - | Important | 7.8 | 6.8 |
| Visual Studio Code Remote Code Execution Vulnerability | |||||||
| %%cve:2026-50520%% | No | No | - | - | Important | 8.4 | 7.3 |
| Visual Studio Code Security Feature Bypass Vulnerability | |||||||
| %%cve:2026-45496%% | No | No | - | - | Important | 5.5 | 4.8 |
| %%cve:2026-57101%% | No | No | - | - | Important | 7.1 | 6.2 |
| %%cve:2026-57102%% | No | No | - | - | Important | 8.8 | 7.7 |
| Visual Studio Remote Code Execution Vulnerability | |||||||
| %%cve:2026-47305%% | No | No | - | - | Important | 7.8 | 6.8 |
| Win32k Elevation of Privilege Vulnerability | |||||||
| %%cve:2026-49805%% | No | No | - | - | Important | 7.0 | 6.1 |
| %%cve:2026-50297%% | No | No | - | - | Important | 7.0 | 6.1 |
| %%cve:2026-50325%% | No | No | - | - | Important | 7.0 | 6.1 |
| %%cve:2026-50489%% | No | No | - | - | Important | 8.8 | 7.7 |
| %%cve:2026-57095%% | No | No | - | - | Important | 6.2 | 5.4 |
| Win32k Information Disclosure Vulnerability | |||||||
| %%cve:2026-50416%% | No | No | - | - | Important | 3.3 | 2.9 |
| %%cve:2026-56184%% | No | No | - | - | Important | 5.5 | 4.8 |
| Window Virtual Filtering Platform (VFP) Denial of Service Vulnerability | |||||||
| %%cve:2026-50432%% | No | No | - | - | Important | 5.3 | 4.6 |
| Windows Active Directory Denial of Service Vulnerability | |||||||
| %%cve:2026-54119%% | No | No | - | - | Important | 7.5 | 6.5 |
| Windows Active Directory Domain Services Denial of Service Vulnerability | |||||||
| %%cve:2026-57976%% | No | No | - | - | Important | 6.5 | 5.7 |
| %%cve:2026-50366%% | No | No | - | - | Important | 6.5 | 5.7 |
| Windows Active Directory Domain Services Remote Code Execution Vulnerability | |||||||
| %%cve:2026-49164%% | No | No | - | - | Critical | 8.1 | 7.1 |
| %%cve:2026-49178%% | No | No | - | - | Important | 8.8 | 7.7 |
| Windows Active Directory Federation Services (ADFS) Information Disclosure Vulnerability | |||||||
| %%cve:2026-58529%% | No | No | - | - | Important | 7.1 | 6.2 |
| Windows Active Directory Federation Services Denial of Service Vulnerability | |||||||
| %%cve:2026-54983%% | No | No | - | - | Important | 7.5 | 6.5 |
| %%cve:2026-50695%% | No | No | - | - | Important | 7.5 | 6.5 |
| %%cve:2026-50304%% | No | No | - | - | Important | 7.5 | 6.5 |
| %%cve:2026-50368%% | No | No | - | - | Important | 7.5 | 6.5 |
| %%cve:2026-50324%% | No | No | - | - | Important | 5.9 | 5.2 |
| %%cve:2026-50355%% | No | No | - | - | Important | 7.5 | 6.5 |
| %%cve:2026-50411%% | No | No | - | - | Important | 7.5 | 6.5 |
| Windows Admin Center (WAC) Remote Code Execution Vulnerability | |||||||
| %%cve:2026-58631%% | No | No | - | - | Important | 7.8 | 6.8 |
| %%cve:2026-56196%% | No | No | - | - | Important | 8.8 | 7.7 |
| %%cve:2026-56197%% | No | No | - | - | Important | 8.8 | 7.7 |
| Windows Admin Center Elevation of Privilege Vulnerability | |||||||
| %%cve:2026-56169%% | No | No | - | - | Important | 8.1 | 7.1 |
| %%cve:2026-57107%% | No | No | - | - | Important | 7.8 | 6.8 |
| Windows Admin Center Information Disclosure Vulnerability | |||||||
| %%cve:2026-56185%% | No | No | - | - | Important | 6.5 | 5.7 |
| Windows Ancillary Function Driver for WinSock Elevation of Privilege Vulnerability | |||||||
| %%cve:2026-50312%% | No | No | - | - | Important | 4.7 | 4.1 |
| %%cve:2026-50462%% | No | No | - | - | Important | 7.8 | 6.8 |
| %%cve:2026-57093%% | No | No | - | - | Important | 7.0 | 6.1 |
| Windows Ancillary Function Driver for WinSock Information Disclosure Vulnerability | |||||||
| %%cve:2026-34346%% | No | No | - | - | Important | 5.5 | 4.8 |
| Windows App Package Installer Elevation of Privilege Vulnerability | |||||||
| %%cve:2026-48572%% | No | No | - | - | Important | 7.0 | 6.1 |
| %%cve:2026-48571%% | No | No | - | - | Important | 7.0 | 6.1 |
| %%cve:2026-50400%% | No | No | - | - | Important | 7.8 | 6.8 |
| Windows AppX Deployment Extensions Elevation of Privilege Vulnerability | |||||||
| %%cve:2026-49803%% | No | No | - | - | Important | 7.0 | 6.1 |
| Windows Application Model Core API Elevation of Privilege Vulnerability | |||||||
| %%cve:2026-50331%% | No | No | - | - | Important | 7.8 | 6.8 |
| Windows Audio Compression Manager (ACM) Elevation of Privilege Vulnerability | |||||||
| %%cve:2026-50351%% | No | No | - | - | Important | 7.8 | 6.8 |
| Windows Audio Service Elevation of Privilege Vulnerability | |||||||
| %%cve:2026-50440%% | No | No | - | - | Important | 7.8 | 6.8 |
| Windows Audio Service Information Disclosure Vulnerability | |||||||
| %%cve:2026-34328%% | No | No | - | - | Important | 5.5 | 4.8 |
| Windows Backup Engine Elevation of Privilege Vulnerability | |||||||
| %%cve:2026-50406%% | No | No | - | - | Important | 7.0 | 6.1 |
| Windows Backup Service Elevation of Privilege Vulnerability | |||||||
| %%cve:2026-50364%% | No | No | - | - | Important | 7.3 | 6.4 |
| Windows BitLocker Security Feature Bypass Vulnerability | |||||||
| %%cve:2026-50661%% | Yes | No | - | - | Important | 6.1 | 5.3 |
| Windows Bluetooth Port Driver Remote Code Execution | |||||||
| %%cve:2026-42975%% | No | No | - | - | Important | 8.0 | 7.0 |
| Windows Bluetooth Service Elevation of Privilege Vulnerability | |||||||
| %%cve:2026-58538%% | No | No | - | - | Important | 7.8 | 6.8 |
| Windows Boot Loader Security Feature Bypass Vulnerability | |||||||
| %%cve:2026-58638%% | No | No | - | - | Important | 6.0 | 5.2 |
| Windows Client-Side Caching Elevation of Privilege Vulnerability | |||||||
| %%cve:2026-58637%% | No | No | - | - | Important | 7.0 | 6.1 |
| Windows Clip Service Elevation of Privilege Vulnerability | |||||||
| %%cve:2026-50384%% | No | No | - | - | Important | 7.0 | 6.1 |
| Windows Clipboard Server Elevation of Privilege Vulnerability | |||||||
| %%cve:2026-49183%% | No | No | - | - | Important | 7.0 | 6.1 |
| %%cve:2026-50689%% | No | No | - | - | Important | 7.8 | 6.8 |
| Windows Cloud Files Mini Filter Driver Elevation of Privilege Vulnerability | |||||||
| %%cve:2026-50374%% | No | No | - | - | Important | 6.3 | 5.5 |
| %%cve:2026-58536%% | No | No | - | - | Important | 7.8 | 6.8 |
| %%cve:2026-58613%% | No | No | - | - | Important | 7.8 | 6.8 |
| Windows Cloud Files Mini Filter Driver Information Disclosure Vulnerability | |||||||
| %%cve:2026-50401%% | No | No | - | - | Important | 5.5 | 4.8 |
| Windows Common Log File System Driver Elevation of Privilege Vulnerability | |||||||
| %%cve:2026-50697%% | No | No | - | - | Important | 7.8 | 6.8 |
| %%cve:2026-50667%% | No | No | - | - | Important | 7.8 | 6.8 |
| Windows Connected User Experiences and Telemetry Elevation of Privilege Vulnerability | |||||||
| %%cve:2026-50421%% | No | No | - | - | Important | 7.8 | 6.8 |
| Windows Container Isolation FS Filter Driver (unionfs.sys) Information Disclosure Vulnerability | |||||||
| %%cve:2026-50428%% | No | No | - | - | Important | 7.1 | 6.2 |
| Windows Cryptographic Services Information Disclosure Vulnerability | |||||||
| %%cve:2026-50352%% | No | No | - | - | Important | 5.5 | 4.8 |
| Windows Cryptographic Services Security Feature Bypass Vulnerability | |||||||
| %%cve:2026-50302%% | No | No | - | - | Important | 4.2 | 3.7 |
| Windows Cryptography API: Next Generation (CNG) Tampering Vulnerability | |||||||
| %%cve:2026-55144%% | No | No | - | - | Important | 7.1 | 6.2 |
| Windows DHCP Client Elevation of Privilege Vulnerability | |||||||
| %%cve:2026-49181%% | No | No | - | - | Important | 7.5 | 6.5 |
| %%cve:2026-50683%% | No | No | - | - | Important | 8.0 | 7.0 |
| Windows DHCP Client Remote Code Execution Vulnerability | |||||||
| %%cve:2026-54128%% | No | No | - | - | Critical | 8.4 | 7.3 |
| Windows DHCP Server Denial of Service Vulnerability | |||||||
| %%cve:2026-58627%% | No | No | - | - | Important | 7.5 | 6.5 |
| Windows DHCP Server Remote Code Execution Vulnerability | |||||||
| %%cve:2026-50518%% | No | No | - | - | Critical | 9.8 | 8.5 |
| %%cve:2026-50685%% | No | No | - | - | Important | 7.5 | 6.5 |
| Windows DNS Client Elevation of Privilege Vulnerability | |||||||
| %%cve:2026-49175%% | No | No | - | - | Important | 7.8 | 6.8 |
| %%cve:2026-50487%% | No | No | - | - | Important | 8.1 | 7.1 |
| Windows DNS Client Tampering Vulnerability | |||||||
| %%cve:2026-50465%% | No | No | - | - | Important | 7.1 | 6.2 |
| Windows DNS Server Remote Code Execution Vulnerability | |||||||
| %%cve:2026-49169%% | No | No | - | - | Important | 8.0 | 7.0 |
| %%cve:2026-50426%% | No | No | - | - | Important | 6.8 | 5.9 |
| Windows DWM Core Library Information Disclosure Vulnerability | |||||||
| %%cve:2026-50300%% | No | No | - | - | Important | 5.5 | 4.8 |
| %%cve:2026-50437%% | No | No | - | - | Important | 5.5 | 4.8 |
| Windows Data.dll Remote Code Execution Vulnerability | |||||||
| %%cve:2026-50347%% | No | No | - | - | Important | 7.8 | 6.8 |
| Windows DirectX Information Disclosure Vulnerability | |||||||
| %%cve:2026-49807%% | No | No | - | - | Important | 6.2 | 5.4 |
| Windows Domain Controller Denial of Service Vulnerability | |||||||
| %%cve:2026-50424%% | No | No | - | - | Important | 7.5 | 6.5 |
| Windows Event Logging Service Information Disclosure Vulnerability | |||||||
| %%cve:2026-34348%% | No | No | - | - | Important | 6.5 | 5.7 |
| Windows Event Logging Service Remote Code Execution Vulnerability | |||||||
| %%cve:2026-50502%% | No | No | - | - | Important | 8.0 | 7.0 |
| Windows FTP Service Remote Code Execution Vulnerability | |||||||
| %%cve:2026-49172%% | No | No | - | - | Important | 9.8 | 8.5 |
| Windows File Explorer Information Disclosure Vulnerability | |||||||
| %%cve:2026-33842%% | No | No | - | - | Important | 5.5 | 4.8 |
| %%cve:2026-40422%% | No | No | - | - | Important | 5.5 | 4.8 |
| %%cve:2026-41087%% | No | No | - | - | Important | 5.5 | 4.8 |
| %%cve:2026-50473%% | No | No | - | - | Important | 5.5 | 4.8 |
| %%cve:2026-50442%% | No | No | - | - | Important | 5.5 | 4.8 |
| %%cve:2026-50389%% | No | No | - | - | Important | 5.5 | 4.8 |
| %%cve:2026-50456%% | No | No | - | - | Important | 5.5 | 4.8 |
| %%cve:2026-57084%% | No | No | - | - | Important | 5.5 | 4.8 |
| Windows File History Service Elevation of Privilege Vulnerability | |||||||
| %%cve:2026-57091%% | No | No | - | - | Important | 7.8 | 6.8 |
| Windows Filtering Platform Elevation of Privilege Vulnerability | |||||||
| %%cve:2026-50405%% | No | No | - | - | Important | 7.8 | 6.8 |
| Windows GDI Elevation of Privilege Vulnerability | |||||||
| %%cve:2026-50387%% | No | No | - | - | Important | 7.8 | 6.8 |
| Windows GDI+ Remote Code Execution Vulnerability | |||||||
| %%cve:2026-54122%% | No | No | - | - | Important | 8.4 | 7.3 |
| %%cve:2026-49796%% | No | No | - | - | Critical | 7.8 | 6.8 |
| %%cve:2026-50380%% | No | No | - | - | Critical | 9.6 | 8.3 |
| Windows Graphics Component Information Disclosure Vulnerability | |||||||
| %%cve:2026-50483%% | No | No | - | - | Important | 5.5 | 4.8 |
| Windows Graphics Component Remote Code Execution Vulnerability | |||||||
| %%cve:2026-58609%% | No | No | - | - | Important | 7.8 | 6.8 |
| Windows Group Policy Elevation of Privilege Vulnerability | |||||||
| %%cve:2026-50391%% | No | No | - | - | Important | 7.8 | 6.8 |
| Windows Human Interface Device Information Disclosure Vulnerability | |||||||
| %%cve:2026-50310%% | No | No | - | - | Important | 4.7 | 4.1 |
| Windows Hyper-V Denial of Service Vulnerability | |||||||
| %%cve:2026-50485%% | No | No | - | - | Important | 4.5 | 3.9 |
| Windows Hyper-V Elevation of Privilege Vulnerability | |||||||
| %%cve:2026-54129%% | No | No | - | - | Important | 7.0 | 6.1 |
| %%cve:2026-54127%% | No | No | - | - | Critical | 7.4 | 6.4 |
| %%cve:2026-50680%% | No | No | - | - | Critical | 8.2 | 7.1 |
| Windows Image Acquisition Elevation of Privilege Vulnerability | |||||||
| %%cve:2026-50315%% | No | No | - | - | Important | 7.8 | 6.8 |
| Windows Input Method Editor (IME) Elevation of Privilege Vulnerability | |||||||
| %%cve:2026-58534%% | No | No | - | - | Important | 8.8 | 7.7 |
| Windows Installer Elevation of Privilege Vulnerability | |||||||
| %%cve:2026-50490%% | No | No | - | - | Important | 7.0 | 6.1 |
| %%cve:2026-58540%% | No | No | - | - | Important | 7.8 | 6.8 |
| Windows Internal System User Profile Elevation of Privilege Vulnerability | |||||||
| %%cve:2026-50425%% | No | No | - | - | Important | 7.8 | 6.8 |
| Windows Internal Task Bar Elevation of Privilege Vulnerability | |||||||
| %%cve:2026-50293%% | No | No | - | - | Important | 7.8 | 6.8 |
| Windows Kernel Elevation of Privilege Vulnerability | |||||||
| %%cve:2026-49167%% | No | No | - | - | Important | 4.7 | 4.1 |
| %%cve:2026-49173%% | No | No | - | - | Important | 7.8 | 6.8 |
| %%cve:2026-54132%% | No | No | - | - | Important | 6.8 | 5.9 |
| %%cve:2026-49795%% | No | No | - | - | Important | 8.8 | 7.7 |
| %%cve:2026-49798%% | No | No | - | - | Important | 9.3 | 8.1 |
| %%cve:2026-49808%% | No | No | - | - | Important | 7.8 | 6.8 |
| %%cve:2026-50354%% | No | No | - | - | Important | 7.1 | 6.2 |
| %%cve:2026-50332%% | No | No | - | - | Important | 7.8 | 6.8 |
| %%cve:2026-50377%% | No | No | - | - | Important | 5.5 | 4.8 |
| %%cve:2026-50390%% | No | No | - | - | Important | 7.0 | 6.1 |
| %%cve:2026-50423%% | No | No | - | - | Important | 7.8 | 6.8 |
| %%cve:2026-50397%% | No | No | - | - | Important | 7.0 | 6.1 |
| %%cve:2026-50436%% | No | No | - | - | Important | 7.8 | 6.8 |
| %%cve:2026-50399%% | No | No | - | - | Important | 7.8 | 6.8 |
| %%cve:2026-50459%% | No | No | - | - | Important | 7.0 | 6.1 |
| %%cve:2026-50477%% | No | No | - | - | Important | 8.8 | 7.7 |
| %%cve:2026-50478%% | No | No | - | - | Important | 7.8 | 6.8 |
| %%cve:2026-50484%% | No | No | - | - | Important | 7.8 | 6.8 |
| %%cve:2026-50673%% | No | No | - | - | Important | 7.8 | 6.8 |
| %%cve:2026-58532%% | No | No | - | - | Important | 7.8 | 6.8 |
| Windows Kernel Information Disclosure Vulnerability | |||||||
| %%cve:2026-50294%% | No | No | - | - | Important | 6.2 | 5.4 |
| %%cve:2026-50316%% | No | No | - | - | Important | 5.5 | 4.8 |
| %%cve:2026-50419%% | No | No | - | - | Important | 3.3 | 2.9 |
| %%cve:2026-50463%% | No | No | - | - | Important | 7.5 | 6.5 |
| %%cve:2026-50475%% | No | No | - | - | Important | 5.5 | 4.8 |
| %%cve:2026-50429%% | No | No | - | - | Important | 8.2 | 7.1 |
| Windows Kernel Security Feature Bypass Vulnerability | |||||||
| %%cve:2026-58614%% | No | No | - | - | Important | 5.5 | 4.8 |
| %%cve:2026-58545%% | No | No | - | - | Important | 5.5 | 4.8 |
| Windows Kernel-Mode Driver Elevation of Privilege Vulnerability | |||||||
| %%cve:2026-58602%% | No | No | - | - | Important | 7.8 | 6.8 |
| %%cve:2026-50393%% | No | No | - | - | Important | 7.0 | 6.1 |
| %%cve:2026-50396%% | No | No | - | - | Important | 7.0 | 6.1 |
| Windows Key Guard Elevation of Privilege Vulnerability | |||||||
| %%cve:2026-50378%% | No | No | - | - | Important | 7.8 | 6.8 |
| Windows Key Guard Security Feature Bypass Vulnerability | |||||||
| %%cve:2026-50303%% | No | No | - | - | Important | 5.5 | 4.8 |
| Windows LUA File Virtualization Filter Driver Elevation of Privilege Vulnerability | |||||||
| %%cve:2026-50371%% | No | No | - | - | Important | 7.0 | 6.1 |
| Windows Local Security Authority Subsystem Service (LSASS) Denial of Service Vulnerability | |||||||
| %%cve:2026-40378%% | No | No | - | - | Important | 7.5 | 6.5 |
| %%cve:2026-49799%% | No | No | - | - | Important | 6.5 | 5.7 |
| Windows MIDI Service Module Elevation of Privileges Vulnerability | |||||||
| %%cve:2026-50342%% | No | No | - | - | Important | 8.8 | 7.7 |
| %%cve:2026-56183%% | No | No | - | - | Important | 7.0 | 6.1 |
| %%cve:2026-56187%% | No | No | - | - | Important | 7.0 | 6.1 |
| Windows Management Services Elevation of Privilege Vulnerability | |||||||
| %%cve:2026-58544%% | No | No | - | - | Important | 7.0 | 6.1 |
| Windows Media Elevation of Privilege Vulnerability | |||||||
| %%cve:2026-50404%% | No | No | - | - | Important | 7.0 | 6.1 |
| %%cve:2026-50358%% | No | No | - | - | Important | 7.0 | 6.1 |
| %%cve:2026-50336%% | No | No | - | - | Important | 7.8 | 6.8 |
| %%cve:2026-50398%% | No | No | - | - | Important | 8.8 | 7.7 |
| %%cve:2026-50414%% | No | No | - | - | Important | 7.5 | 6.5 |
| %%cve:2026-50379%% | No | No | - | - | Important | 7.5 | 6.5 |
| %%cve:2026-50433%% | No | No | - | - | Important | 7.8 | 6.8 |
| %%cve:2026-50676%% | No | No | - | - | Important | 7.8 | 6.8 |
| %%cve:2026-50677%% | No | No | - | - | Important | 7.8 | 6.8 |
| Windows Media Information Disclosure Vulnerability | |||||||
| %%cve:2026-34349%% | No | No | - | - | Important | 5.5 | 4.8 |
| %%cve:2026-50394%% | No | No | - | - | Important | 5.5 | 4.8 |
| %%cve:2026-50415%% | No | No | - | - | Important | 5.3 | 4.6 |
| Windows Media Photo Codec Information Disclosure Vulnerability | |||||||
| %%cve:2026-57083%% | No | No | - | - | Important | 5.5 | 4.8 |
| Windows Media Remote Code Execution Vulnerability | |||||||
| %%cve:2026-50327%% | No | No | - | - | Critical | 7.8 | 6.8 |
| %%cve:2026-58542%% | No | No | - | - | Critical | 7.8 | 6.8 |
| Windows Message Queuing (MSMQ) Elevation of Privilege Vulnerability | |||||||
| %%cve:2026-54115%% | No | No | - | - | Important | 7.8 | 6.8 |
| Windows Message Queuing Service (MSMQ) Remote Code Execution Vulnerability | |||||||
| %%cve:2026-50447%% | No | No | - | - | Important | 9.8 | 8.5 |
| %%cve:2026-50505%% | No | No | - | - | Important | 7.5 | 6.5 |
| Windows NFS Server Elevation of Privilege Vulnerability | |||||||
| %%cve:2026-56194%% | No | No | - | - | Important | 8.8 | 7.7 |
| %%cve:2026-56648%% | No | No | - | - | Important | 7.5 | 6.5 |
| Windows NTFS Elevation of Privilege Vulnerability | |||||||
| %%cve:2026-49789%% | No | No | - | - | Important | 7.3 | 6.4 |
| %%cve:2026-50412%% | No | No | - | - | Important | 7.8 | 6.8 |
| %%cve:2026-50422%% | No | No | - | - | Important | 7.8 | 6.8 |
| %%cve:2026-50672%% | No | No | - | - | Important | 7.0 | 6.1 |
| %%cve:2026-56175%% | No | No | - | - | Important | 7.8 | 6.8 |
| %%cve:2026-56182%% | No | No | - | - | Important | 7.8 | 6.8 |
| Windows NTFS Information Disclosure Vulnerability | |||||||
| %%cve:2026-50341%% | No | No | - | - | Important | 5.5 | 4.8 |
| Windows NTFS Remote Code Execution Vulnerability | |||||||
| %%cve:2026-58640%% | No | No | - | - | Important | 7.3 | 6.4 |
| %%cve:2026-49184%% | No | No | - | - | Important | 8.4 | 7.3 |
| %%cve:2026-49797%% | No | No | - | - | Important | 7.8 | 6.8 |
| %%cve:2026-50308%% | No | No | - | - | Important | 7.8 | 6.8 |
| %%cve:2026-50386%% | No | No | - | - | Important | 7.8 | 6.8 |
| %%cve:2026-50309%% | No | No | - | - | Important | 7.8 | 6.8 |
| %%cve:2026-50313%% | No | No | - | - | Important | 7.8 | 6.8 |
| %%cve:2026-50388%% | No | No | - | - | Important | 7.8 | 6.8 |
| %%cve:2026-50448%% | No | No | - | - | Important | 7.8 | 6.8 |
| %%cve:2026-50471%% | No | No | - | - | Important | 7.8 | 6.8 |
| %%cve:2026-50461%% | No | No | - | - | Important | 7.8 | 6.8 |
| %%cve:2026-50417%% | No | No | - | - | Important | 7.8 | 6.8 |
| %%cve:2026-50482%% | No | No | - | - | Important | 7.3 | 6.4 |
| %%cve:2026-50494%% | No | No | - | - | Important | 7.8 | 6.8 |
| Windows Narrator Braille Elevation of Privilege Vulnerability | |||||||
| %%cve:2026-58635%% | No | No | - | - | Important | 7.8 | 6.8 |
| Windows Netlogon Elevation of Privilege Vulnerability | |||||||
| %%cve:2026-50500%% | No | No | - | - | Important | 7.5 | 6.5 |
| Windows Network Address Translation (NAT) Spoofing Vulnerability | |||||||
| %%cve:2026-56181%% | No | No | - | - | Moderate | 8.3 | 7.2 |
| Windows Network Connections Service Elevation of Privilege Vulnerability | |||||||
| %%cve:2026-50476%% | No | No | - | - | Important | 7.8 | 6.8 |
| %%cve:2026-50450%% | No | No | - | - | Important | 7.8 | 6.8 |
| Windows Network File System Elevation of Privilege Vulnerability | |||||||
| %%cve:2026-56650%% | No | No | - | - | Important | 7.8 | 6.8 |
| Windows Network File System Remote Code Execution Vulnerability | |||||||
| %%cve:2026-56649%% | No | No | - | - | Important | 5.9 | 5.2 |
| Windows Network Policy Server SNMP Information Disclosure Vulnerability | |||||||
| %%cve:2026-50470%% | No | No | - | - | Important | 7.5 | 6.5 |
| %%cve:2026-50496%% | No | No | - | - | Important | 7.5 | 6.5 |
| Windows Notification Elevation of Privilege Vulnerability | |||||||
| %%cve:2026-50337%% | No | No | - | - | Important | 7.8 | 6.8 |
| Windows OLE Elevation of Privilege Vulnerability | |||||||
| %%cve:2026-50344%% | No | No | - | - | Important | 7.8 | 6.8 |
| Windows OLE Remote Code Execution Vulnerability | |||||||
| %%cve:2026-50686%% | No | No | - | - | Important | 8.1 | 7.1 |
| Windows Operating Systems Elevation of Privilege Vulnerability | |||||||
| %%cve:2026-50335%% | No | No | - | - | Important | 7.8 | 6.8 |
| %%cve:2026-50317%% | No | No | - | - | Important | 7.8 | 6.8 |
| Windows Overlay Filter Elevation of Privilege Vulnerability | |||||||
| %%cve:2026-54987%% | No | No | - | - | Important | 7.8 | 6.8 |
| %%cve:2026-50435%% | No | No | - | - | Important | 7.8 | 6.8 |
| Windows Overlay Filter Information Disclosure Vulnerability | |||||||
| %%cve:2026-50409%% | No | No | - | - | Important | 5.5 | 4.8 |
| Windows PowerShell Remote Code Execution Vulnerability | |||||||
| %%cve:2026-40400%% | No | No | - | - | Important | 8.0 | 7.0 |
| Windows Print Configuration Elevation of Privilege Vulnerability | |||||||
| %%cve:2026-49166%% | No | No | - | - | Important | 7.8 | 6.8 |
| %%cve:2026-55004%% | No | No | - | - | Important | 7.8 | 6.8 |
| Windows Print Spooler Elevation of Privilege Vulnerability | |||||||
| %%cve:2026-50499%% | No | No | - | - | Important | 7.8 | 6.8 |
| Windows Print Spooler Information Disclosure Vulnerability | |||||||
| %%cve:2026-50383%% | No | No | - | - | Important | 6.1 | 5.3 |
| %%cve:2026-57085%% | No | No | - | - | Important | 5.5 | 4.8 |
| Windows Print Spooler Remote Code Execution Vulnerability | |||||||
| %%cve:2026-58608%% | No | No | - | - | Critical | 8.8 | 7.7 |
| Windows Projected File System Elevation of Privilege Vulnerability | |||||||
| %%cve:2026-50469%% | No | No | - | - | Important | 7.8 | 6.8 |
| Windows Push Notification Information Disclosure Vulnerability | |||||||
| %%cve:2026-50434%% | No | No | - | - | Important | 5.5 | 4.8 |
| %%cve:2026-50339%% | No | No | - | - | Important | 5.5 | 4.8 |
| %%cve:2026-50430%% | No | No | - | - | Important | 5.5 | 4.8 |
| %%cve:2026-50334%% | No | No | - | - | Important | 5.5 | 4.8 |
| Windows Push Notifications Elevation of Privilege Vulnerability | |||||||
| %%cve:2026-44800%% | No | No | - | - | Important | 7.8 | 6.8 |
| %%cve:2026-50363%% | No | No | - | - | Important | 7.8 | 6.8 |
| Windows Quality of Service (QoS) Packet Scheduler Information Disclosure Vulnerability | |||||||
| %%cve:2026-50431%% | No | No | - | - | Important | 5.5 | 4.8 |
| Windows Redirected Drive Buffering System Elevation of Privilege Vulnerability | |||||||
| %%cve:2026-50372%% | No | No | - | - | Important | 7.0 | 6.1 |
| Windows Reliable Multicast Transport Driver (RMCAST) Remote Code Execution Vulnerability | |||||||
| %%cve:2026-54982%% | No | No | - | - | Critical | 8.8 | 7.7 |
| %%cve:2026-54995%% | No | No | - | - | Critical | 8.1 | 7.1 |
| Windows Remote Access Elevation of Privilege Vulnerability | |||||||
| %%cve:2026-50666%% | No | No | - | - | Important | 8.8 | 7.7 |
| Windows Remote Access Service Infrastructure Elevation of Privilege Vulnerability | |||||||
| %%cve:2026-56647%% | No | No | - | - | Important | 8.8 | 7.7 |
| Windows Remote Desktop Client Elevation of Privilege Vulnerability | |||||||
| %%cve:2026-50330%% | No | No | - | - | Important | 7.5 | 6.5 |
| Windows Remote Desktop Client Information Disclosure Vulnerability | |||||||
| %%cve:2026-50376%% | No | No | - | - | Important | 6.5 | 5.7 |
| %%cve:2026-50504%% | No | No | - | - | Important | 6.5 | 5.7 |
| %%cve:2026-58533%% | No | No | - | - | Important | 6.5 | 5.7 |
| %%cve:2026-58535%% | No | No | - | - | Important | 6.5 | 5.7 |
| %%cve:2026-58546%% | No | No | - | - | Important | 6.5 | 5.7 |
| %%cve:2026-58539%% | No | No | - | - | Important | 6.5 | 5.7 |
| Windows Remote Desktop Protocol (RDP) Information Disclosure Vulnerability | |||||||
| %%cve:2026-55003%% | No | No | - | - | Important | 6.5 | 5.7 |
| %%cve:2026-57979%% | No | No | - | - | Important | 6.5 | 5.7 |
| %%cve:2026-50445%% | No | No | - | - | Important | 6.5 | 5.7 |
| %%cve:2026-50497%% | No | No | - | - | Important | 6.5 | 5.7 |
| %%cve:2026-54126%% | No | No | - | - | Important | 6.5 | 5.7 |
| %%cve:2026-57982%% | No | No | - | - | Important | 6.5 | 5.7 |
| Windows Remote Desktop Services Elevation of Privilege Vulnerability | |||||||
| %%cve:2026-50369%% | No | No | - | - | Important | 8.8 | 7.7 |
| Windows Remote Desktop Services Remote Code Execution Vulnerability | |||||||
| %%cve:2026-58626%% | No | No | - | - | Important | 8.8 | 7.7 |
| Windows Remote Help Defense Elevation of Privilege Vulnerability | |||||||
| %%cve:2026-55014%% | No | No | - | - | Important | 7.8 | 6.8 |
| Windows Resilient File System (ReFS) Elevation of Privilege Vulnerability | |||||||
| %%cve:2026-50318%% | No | No | - | - | Important | 7.8 | 6.8 |
| %%cve:2026-50407%% | No | No | - | - | Important | 7.8 | 6.8 |
| %%cve:2026-50357%% | No | No | - | - | Important | 7.8 | 6.8 |
| %%cve:2026-50441%% | No | No | - | - | Important | 7.8 | 6.8 |
| %%cve:2026-50668%% | No | No | - | - | Important | 6.8 | 5.9 |
| Windows Resilient File System (ReFS) Remote Code Execution Vulnerability | |||||||
| %%cve:2026-54109%% | No | No | - | - | Important | 7.8 | 6.8 |
| %%cve:2026-49792%% | No | No | - | - | Important | 7.8 | 6.8 |
| %%cve:2026-49793%% | No | No | - | - | Important | 7.8 | 6.8 |
| %%cve:2026-50362%% | No | No | - | - | Important | 7.8 | 6.8 |
| %%cve:2026-50492%% | No | No | - | - | Important | 6.8 | 5.9 |
| %%cve:2026-50501%% | No | No | - | - | Important | 7.8 | 6.8 |
| %%cve:2026-58530%% | No | No | - | - | Important | 7.8 | 6.8 |
| Windows Routing and Remote Access Service (RRAS) Elevation of Privilege Vulnerability | |||||||
| %%cve:2026-49791%% | No | No | - | - | Important | 7.1 | 6.2 |
| %%cve:2026-50451%% | No | No | - | - | Important | 7.1 | 6.2 |
| %%cve:2026-57096%% | No | No | - | - | Important | 7.8 | 6.8 |
| Windows Runtime Elevation of Privilege Vulnerability | |||||||
| %%cve:2026-50323%% | No | No | - | - | Important | 7.0 | 6.1 |
| %%cve:2026-50452%% | No | No | - | - | Important | 7.0 | 6.1 |
| %%cve:2026-50348%% | No | No | - | - | Important | 7.0 | 6.1 |
| %%cve:2026-50345%% | No | No | - | - | Important | 7.0 | 6.1 |
| %%cve:2026-50322%% | No | No | - | - | Important | 7.0 | 6.1 |
| %%cve:2026-50340%% | No | No | - | - | Important | 8.5 | 7.4 |
| %%cve:2026-50410%% | No | No | - | - | Important | 7.0 | 6.1 |
| %%cve:2026-50449%% | No | No | - | - | Important | 7.0 | 6.1 |
| %%cve:2026-50460%% | No | No | - | - | Important | 8.1 | 7.1 |
| %%cve:2026-50403%% | No | No | - | - | Important | 7.0 | 6.1 |
| %%cve:2026-50385%% | No | No | - | - | Important | 8.8 | 7.7 |
| %%cve:2026-50413%% | No | No | - | - | Important | 8.8 | 7.7 |
| %%cve:2026-50457%% | No | No | - | - | Important | 7.8 | 6.8 |
| %%cve:2026-50486%% | No | No | - | - | Important | 7.8 | 6.8 |
| %%cve:2026-50503%% | No | No | - | - | Important | 7.0 | 6.1 |
| %%cve:2026-54125%% | No | No | - | - | Important | 7.8 | 6.8 |
| %%cve:2026-58527%% | No | No | - | - | Important | 7.8 | 6.8 |
| Windows SMB Elevation of Privilege Vulnerability | |||||||
| %%cve:2026-58531%% | No | No | - | - | Important | 7.5 | 6.5 |
| Windows SMB Information Disclosure Vulnerability | |||||||
| %%cve:2026-54997%% | No | No | - | - | Important | 5.5 | 4.8 |
| %%cve:2026-49801%% | No | No | - | - | Important | 5.5 | 4.8 |
| %%cve:2026-50690%% | No | No | - | - | Important | 5.5 | 4.8 |
| Windows SMB Server Denial of Service Vulnerability | |||||||
| %%cve:2026-56168%% | No | No | - | - | Important | 6.5 | 5.7 |
| Windows SMB Server Elevation of Privilege Vulnerability | |||||||
| %%cve:2026-50360%% | No | No | - | - | Important | 8.8 | 7.7 |
| Windows SMB Server Network Transport Driver (srvnet.sys) Remote Code Execution Vulnerability | |||||||
| %%cve:2026-57089%% | No | No | - | - | Important | 7.5 | 6.5 |
| Windows Search Service Elevation of Privilege Vulnerability | |||||||
| %%cve:2026-50373%% | No | No | - | - | Important | 7.8 | 6.8 |
| %%cve:2026-50679%% | No | No | - | - | Important | 7.8 | 6.8 |
| Windows Secure Channel Denial of Service Vulnerability | |||||||
| %%cve:2026-44806%% | No | No | - | - | Important | 5.3 | 4.6 |
| Windows Secure Channel Information Disclosure Vulnerability | |||||||
| %%cve:2026-50681%% | No | No | - | - | Important | 5.5 | 4.8 |
| %%cve:2026-56186%% | No | No | - | - | Important | 8.1 | 7.1 |
| Windows Secure Kernel Mode Elevation of Privilege Vulnerability | |||||||
| %%cve:2026-42982%% | No | No | - | - | Critical | 7.8 | 6.8 |
| %%cve:2026-50392%% | No | No | - | - | Critical | 7.0 | 6.1 |
| Windows Secure Socket Tunneling Protocol (SSTP) Remote Code Execution Vulnerability | |||||||
| %%cve:2026-50694%% | No | No | - | - | Critical | 8.1 | 7.1 |
| Windows Sensor Data Service Elevation of Privilege Vulnerability | |||||||
| %%cve:2026-50367%% | No | No | - | - | Important | 7.8 | 6.8 |
| %%cve:2026-58619%% | No | No | - | - | Important | 7.0 | 6.1 |
| Windows Server Elevation of Privilege Vulnerability | |||||||
| %%cve:2026-50311%% | No | No | - | - | Important | 7.8 | 6.8 |
| Windows Server Network driver Remote Code Execution Vulnerability | |||||||
| %%cve:2026-56188%% | No | No | - | - | Critical | 9.8 | 8.5 |
| Windows Server Update Service (WSUS) Elevation of Privilege Vulnerability | |||||||
| %%cve:2026-50444%% | No | No | - | - | Critical | 8.8 | 7.7 |
| Windows Server Update Service (WSUS) Tampering Vulnerability | |||||||
| %%cve:2026-50328%% | No | No | - | - | Important | 7.5 | 6.5 |
| Windows Spaceport.sys Elevation of Privilege Vulnerability | |||||||
| %%cve:2026-50333%% | No | No | - | - | Important | 7.8 | 6.8 |
| %%cve:2026-50298%% | No | No | - | - | Important | 6.8 | 5.9 |
| Windows Speech Runtime Elevation of Privilege Vulnerability | |||||||
| %%cve:2026-49171%% | No | No | - | - | Important | 7.5 | 6.5 |
| Windows StateRepository API Server file Elevation of Privilege Vulnerability | |||||||
| %%cve:2026-49170%% | No | No | - | - | Important | 7.8 | 6.8 |
| Windows Storage Elevation of Privilege Vulnerability | |||||||
| %%cve:2026-58526%% | No | No | - | - | Important | 7.0 | 6.1 |
| Windows Storage Spaces Direct Remote Code Execution Vulnerability | |||||||
| %%cve:2026-50299%% | No | No | - | - | Important | 6.8 | 5.9 |
| Windows Subsystem for Linux (WSL2) Kernel Elevation of Privilege Vulnerability | |||||||
| %%cve:2026-57968%% | No | No | - | - | Important | 7.8 | 6.8 |
| Windows Subsystem for Linux (WSL2) Kernel Tampering Vulnerability | |||||||
| %%cve:2026-57973%% | No | No | - | - | Important | 6.3 | 5.5 |
| Windows System Secure Feature Bypass Vulnerability | |||||||
| %%cve:2026-50418%% | No | No | - | - | Important | 5.1 | 4.5 |
| Windows TCP/IP Elevation of Privilege Vulnerability | |||||||
| %%cve:2026-50306%% | No | No | - | - | Important | 7.8 | 6.8 |
| %%cve:2026-50307%% | No | No | - | - | Important | 7.0 | 6.1 |
| Windows TCP/IP Information Disclosure Vulnerability | |||||||
| %%cve:2026-49177%% | No | No | - | - | Important | 5.5 | 4.8 |
| Windows TCP/IP Remote Code Execution Vulnerability | |||||||
| %%cve:2026-54999%% | No | No | - | - | Critical | 8.8 | 7.7 |
| Windows Telephony Server Elevation of Privilege Vulnerability | |||||||
| %%cve:2026-50669%% | No | No | - | - | Important | 7.0 | 6.1 |
| Windows Terminal Remote Code Execution Vulnerability | |||||||
| %%cve:2026-54124%% | No | No | - | - | Important | 7.8 | 6.8 |
| Windows Trusted Runtime Interface Driver Information Disclosure Vulnerability | |||||||
| %%cve:2026-50350%% | No | No | - | - | Important | 5.5 | 4.8 |
| Windows USB Audio Class Driver Information Disclosure Vulnerability | |||||||
| %%cve:2026-49794%% | No | No | - | - | Important | 4.6 | 4.0 |
| %%cve:2026-50453%% | No | No | - | - | Important | 6.1 | 5.3 |
| %%cve:2026-58528%% | No | No | - | - | Important | 6.8 | 5.9 |
| Windows USB Driver Elevation of Privilege Vulnerability | |||||||
| %%cve:2026-50321%% | No | No | - | - | Important | 7.8 | 6.8 |
| Windows USB Hub Driver Elevation of Privilege Vulnerability | |||||||
| %%cve:2026-50479%% | No | No | - | - | Important | 7.8 | 6.8 |
| Windows USB Print Driver Elevation of Privilege Vulnerability | |||||||
| %%cve:2026-55000%% | No | No | - | - | Important | 6.4 | 5.6 |
| %%cve:2026-54991%% | No | No | - | - | Important | 7.8 | 6.8 |
| %%cve:2026-54996%% | No | No | - | - | Important | 7.0 | 6.1 |
| %%cve:2026-49802%% | No | No | - | - | Important | 7.0 | 6.1 |
| %%cve:2026-49806%% | No | No | - | - | Important | 7.0 | 6.1 |
| %%cve:2026-50674%% | No | No | - | - | Important | 7.0 | 6.1 |
| Windows USB Video Driver Elevation of Privilege Vulnerability | |||||||
| %%cve:2026-49804%% | No | No | - | - | Important | 6.6 | 5.8 |
| Windows Unified Consent System Elevation of Privilege Vulnerability | |||||||
| %%cve:2026-50326%% | No | No | - | - | Important | 7.8 | 6.8 |
| Windows Universal Disk Format File System Driver (UDFS) Elevation of Privilege Vulnerability | |||||||
| %%cve:2026-49790%% | No | No | - | - | Important | 7.3 | 6.4 |
| %%cve:2026-50498%% | No | No | - | - | Important | 7.8 | 6.8 |
| Windows Universal Plug and Play (UPnP) Device Host Elevation of Privilege Vulnerability | |||||||
| %%cve:2026-58547%% | No | No | - | - | Important | 5.5 | 4.8 |
| Windows User Interface Core Elevation of Privilege Vulnerability | |||||||
| %%cve:2026-50454%% | No | No | - | - | Important | 7.8 | 6.8 |
| Windows WalletService Elevation of Privilege Vulnerability | |||||||
| %%cve:2026-49176%% | No | No | - | - | Important | 7.8 | 6.8 |
| Windows Web Proxy Auto-Discovery Protocol (WPAD) Elevation of Privilege Vulnerability | |||||||
| %%cve:2026-49800%% | No | No | - | - | Important | 7.8 | 6.8 |
| %%cve:2026-50480%% | No | No | - | - | Important | 7.8 | 6.8 |
| Windows WebView Elevation of Privilege Vulnerability | |||||||
| %%cve:2026-56173%% | No | No | - | - | Important | 7.0 | 6.1 |
| Windows Win32 Kernel Subsystem Elevation of Privilege Vulnerability | |||||||
| %%cve:2026-58632%% | No | No | - | - | Important | 7.8 | 6.8 |
| Windows Win32k Elevation of Privilege Vulnerability | |||||||
| %%cve:2026-54107%% | No | No | - | - | Important | 8.8 | 7.7 |
| %%cve:2026-54986%% | No | No | - | - | Important | 7.8 | 6.8 |
| %%cve:2026-54112%% | No | No | - | - | Important | 7.8 | 6.8 |
| %%cve:2026-54114%% | No | No | - | - | Important | 7.8 | 6.8 |
| %%cve:2026-50670%% | No | No | - | - | Important | 8.8 | 7.7 |
| %%cve:2026-50688%% | No | No | - | - | Important | 7.8 | 6.8 |
| %%cve:2026-50687%% | No | No | - | - | Important | 8.8 | 7.7 |
| %%cve:2026-56176%% | No | No | - | - | Important | 7.8 | 6.8 |
| Windows Wireless Network Manager Elevation of Privilege Vulnerability | |||||||
| %%cve:2026-58628%% | No | No | - | - | Important | 7.8 | 6.8 |
| Windows Zero Trust DNS Security Feature Bypass Vulnerability | |||||||
| %%cve:2026-50295%% | No | No | - | - | Important | 5.5 | 4.8 |
| Wireless Wide Area Network Service (WwanSvc) Elevation of Privilege Vulnerability | |||||||
| %%cve:2026-50509%% | No | No | - | - | Important | 7.8 | 6.8 |
--
Johannes B. Ullrich, Ph.D. , Dean of Research, SANS.edu
Twitter|
0 Comments
Someone Is Scanning for Your MCP Servers and AI Assistant Credentials
The setup
I pulled 14 days of Apache and ModSecurity logs from a single small web host. Nothing special about it. A handful of low-traffic virtual hosts. A WordPress site, a couple of custom application backends, a static devotional site. The kind of server that exists by the millions and that nobody would call a high-value target. Server IP and hostnames are anonymized throughout this diary.
The point of looking was not to find a breach. It was to see what the background radiation of internet scanning looks like in 2026. Most of it is exactly what you would expect. WordPress xmlrpc floods. Endless .env probing. Git config fishing. But mixed into the noise was a category of scanning I had not seen documented before. Someone is systematically looking for Model Context Protocol servers, AI assistant configuration files, and locally exposed LLM endpoints. On a server that runs none of those things.
The overall picture
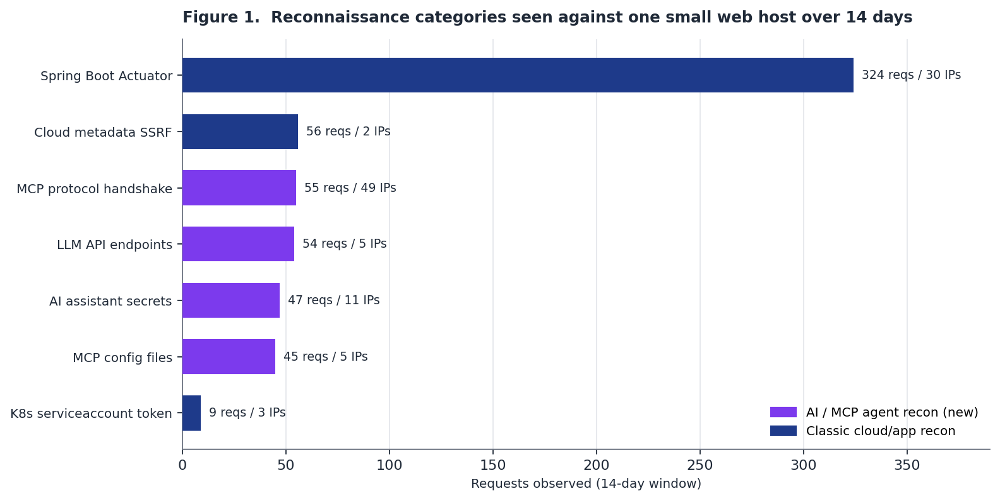
Figure 1 breaks down the reconnaissance categories that ModSecurity flagged over the two-week window. I split them into two groups. The classic cloud and application recon that every server sees, and the newer AI-agent recon that is the subject of this diary.
 ???????
Spring Boot Actuator scanning dominates by request volume. That is not new. The full set of actuator endpoints including /actuator/heapdump and /actuator/env gets hit hundreds of times from dozens of sources. The interesting part is the group below it. MCP handshakes, LLM API probes, AI assistant secret fishing, and MCP config files together account for roughly 200 requests. And the MCP protocol handshake category came from 49 distinct source IPs, more spread than any other category in the dataset. This is not one researcher. It is a broad, distributed scan.
The Part That Stood Out: A Real MCP Handshake
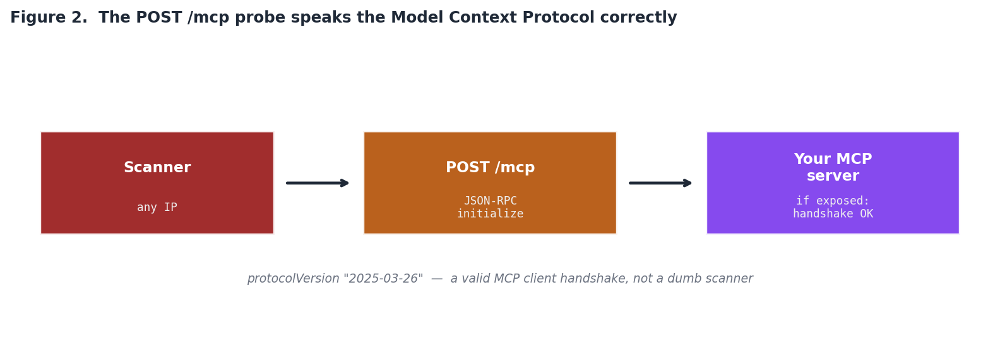
Most scanning is dumb. A bot requests a path, checks the status code, moves on. The POST /mcp probes were different. Every one of them carried a valid JSON-RPC 2.0 body performing a Model Context Protocol initialize call.
Content-Type: application/json
{"id":1,"jsonrpc":"2.0","method":"initialize",
"params":{"capabilities":{},
"clientInfo":{"name":"client","version":"0"},
"protocolVersion":"2025-03-26"}}
This matters. The scanner is not blindly requesting a URL. It is speaking the protocol. It sends a correctly formed handshake with a real MCP protocol version and waits to see if something on the other end answers like an MCP server. If your server responds to that initialize call then the next steps are to enumerate the tools the server exposes, the data sources it connects to, and whatever it can be convinced to do. Figure 2 shows the flow.
For readers who have not deployed one yet: an MCP server is the bridge that lets an AI agent call tools and read data sources. It is the thing that gives a model access to your database, your file system, your ticketing system, your internal APIs. An exposed and unauthenticated MCP server is close to the worst case. It is a remote, machine-readable menu of everything an agent can touch, offered to anyone who completes the handshake. The scanners clearly know this and are looking for them at internet scale.
Fishing for AI Assistant Configs and Credentials
Alongside the live-server handshakes, the scanners fished aggressively for configuration and credential files belonging to AI coding assistants. These are the files that tools like Claude and Cursor write to a project or home directory. When developers accidentally deploy them to a web root, they leak.
The paths requested were specific and current. Not guesses. Someone built this wordlist recently and from real knowledge of how these tools store their settings.
GET /.cursor/mcp.json
GET /.cursor/mcp_config.json
GET /.vscode/mcp.json
GET /.mcp/config.json
GET /.claude/settings.local.json
HEAD /.claude/.credentials.json
HEAD /.config/claude/.credentials.json
The use of HEAD for the credential files is a tell. HEAD returns headers without a body. The scanner is checking whether the file exists before spending bandwidth to download it. That is an efficiency optimization you build when you are scanning a very large number of hosts and expect most to be misses. It signals a mature, wide campaign rather than a one-off curiosity probe.
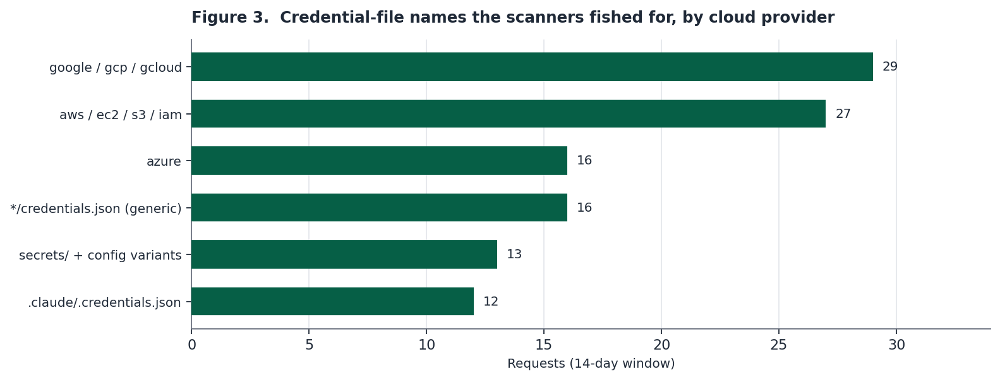
The same run also fished for cloud credential files across every major provider. Figure 3 shows the spread. Generic credentials.json, then GCP, AWS, and Azure specific variants, then Kubernetes and application-specific names. The AI assistant credentials sit inside this same wordlist, which tells you the tooling authors now treat AI assistant secrets as just another cloud credential worth harvesting.
Looking for Unauthenticated LLM Endpoints
The third strand was probing for exposed LLM inference endpoints. Two signatures dominated.
- GET /v1/models is the OpenAI-compatible model-listing endpoint. Dozens of self-hosted inference servers expose it. If it answers without authentication then the host is running a model that anyone can query, which means free compute for the attacker and a potential pivot point.
- GET /api/tags is the Ollama endpoint that lists locally installed models. Ollama binds to localhost by default but is very commonly exposed to the network by accident. A response here is a strong signal of an unauthenticated local LLM.
Neither endpoint exists on the host I was looking at. Both were requested repeatedly from multiple sources. The scanners are casting a wide net for anyone who stood up a local model and forgot to put it behind authentication.
The Classic That Rode Along: Cloud Metadata SSRF
Bundled with the AI-agent recon was a familiar technique that pairs naturally with it. SSRF attempts targeting the cloud metadata service to steal instance credentials.
GET /fetch?uri=http://metadata.google.internal/...token
GET /fetch?path=http://metadata.google.internal/...token
GET /fetch?dest=http://metadata.google.internal/...token
The scanner rotates the parameter name across url, uri, path, and dest. It is looking for any proxy or fetch endpoint that will follow a supplied URL. The target is the GCP metadata endpoint that returns a service-account token. This is worth flagging in the AI context because agent and LLM tooling frequently includes fetch-style helpers that take a URL and retrieve it. That is exactly the kind of endpoint this probe is built to find. An MCP server or an agent tool that fetches arbitrary URLs is a ready-made SSRF primitive.
What to Check on Your Own Hosts
Concrete things to look for in your own logs and infrastructure.
- Grep for the MCP handshake. Search access logs for POST /mcp and /sse. If you do not run an MCP server, any such request is pure recon and a useful indicator to block. If you do run one, confirm it requires authentication and is not reachable from the internet.
- Hunt for AI-config paths in your web roots. Make sure no .claude/, .cursor/, .vscode/mcp.json, or .credentials.json file is served by your web server. These belong in developer home directories, never in a deployed web root.
- Check for accidentally exposed LLM endpoints. From outside your network, request /v1/models and /api/tags against your hosts. If either answers, you have an unauthenticated model exposed.
- Review fetch-style endpoints for SSRF. Any endpoint that takes a URL parameter and retrieves it should block requests to 169.254.169.254 and metadata.google.internal. This applies doubly to agent tooling.
- Enable metadata service protection. On GCP use metadata server v1 with header enforcement. On AWS require IMDSv2. This defangs the metadata SSRF even if a vulnerable fetch endpoint exists.
Indicator Reference
The full set of AI-agent recon signatures observed, with the intent behind each.
|
Request path probed |
What the attacker is after |
|
POST /mcp (JSON-RPC initialize) |
A live Model Context Protocol server to enumerate tools and data sources |
|
GET /sse |
Server-Sent Events transport used by older MCP servers |
|
/.claude/mcp.json /.cursor/mcp.json |
MCP client config with server endpoints and sometimes API keys |
|
/.vscode/mcp.json /.mcp/config.json |
Editor and project-level MCP configuration |
|
HEAD /.claude/.credentials.json |
Stored credentials for an AI coding assistant. HEAD checks existence first |
|
GET /v1/models /api/tags |
An unauthenticated LLM endpoint (OpenAI-compatible or Ollama) |
|
/fetch?url=...metadata.google.internal |
SSRF to steal a GCP service-account token via a proxy endpoint |
|
/var/run/secrets/.../serviceaccount/token |
A Kubernetes service-account token via path traversal or misrouting |
Conclusion
None of the AI-agent infrastructure the scanners were looking for existed on this host. That is the point. This is broad, opportunistic, internet-wide scanning that has already added MCP servers, AI assistant credentials, and local LLM endpoints to its standard target list. The tooling authors did not wait for these deployments to become common. They are scanning ahead of the curve, ready for the moment a developer exposes one.
The lesson for defenders is simple. Your attack surface grew when your organization adopted AI agents, and the scanners already know it. An exposed MCP server is a machine-readable inventory of everything an agent can do, offered to anyone who speaks the protocol. An AI assistant credential file in a web root is a working key. A local LLM without authentication is free compute and a pivot point. Treat all three as the sensitive, internet-facing assets they now are. The scanning confirms someone else already does.
Manuel Humberto Santander Peláez
SANS Internet Storm Center - Handler
X: @manuelsantander
Mastodon:[email protected]
Linkedin: https://linkedin.com/in/manuelsantander
email: [email protected]
0 Comments
Wireshark 4.6.7 Released
Wireshark release 4.6.7 fixes 12 vulnerabilities and 16 bugs.
Didier Stevens
Senior handler
blog.DidierStevens.com
1 Comments
"Comment stuffing" in an HTML phishing attachment as a mechanism for evading AI-based detection?
Anyone who deals with phishing messages caught by basic security filters knows that most phishing samples tend to blend into one another, since only a small set of techniques and approaches keeps reappearing in them. That is precisely why it is worth pausing on the occasional message that does something a little out of the ordinary.
One such unusual message was caught on Tuesday by an e-mail security solution used by one of my clients. At first glance, both the e-mail body and the attached credential-stealing HTML page looked entirely generic, however, the fact that the attachment was fairly large, and that Outlook claimed the date on which the e-mail had been sent was “None”, caught my attention and made me take a second look… Which was fortunate, because it appears that the large size of the attachment might be connected to the increasing role that AI is playing in e-mail security in an interesting way.
Before we get to the attachment, however, the phishing message itself deserves a brief mention, since several small details in its headers suggest that it was not sent through any normal mail path, but rather generated by a simple, homemade script.
The e-mail presented itself as a Microsoft Teams notification about a document shared over SharePoint, with another document attached directly to the message (note the text “None” in the upper right corner where a date should be).
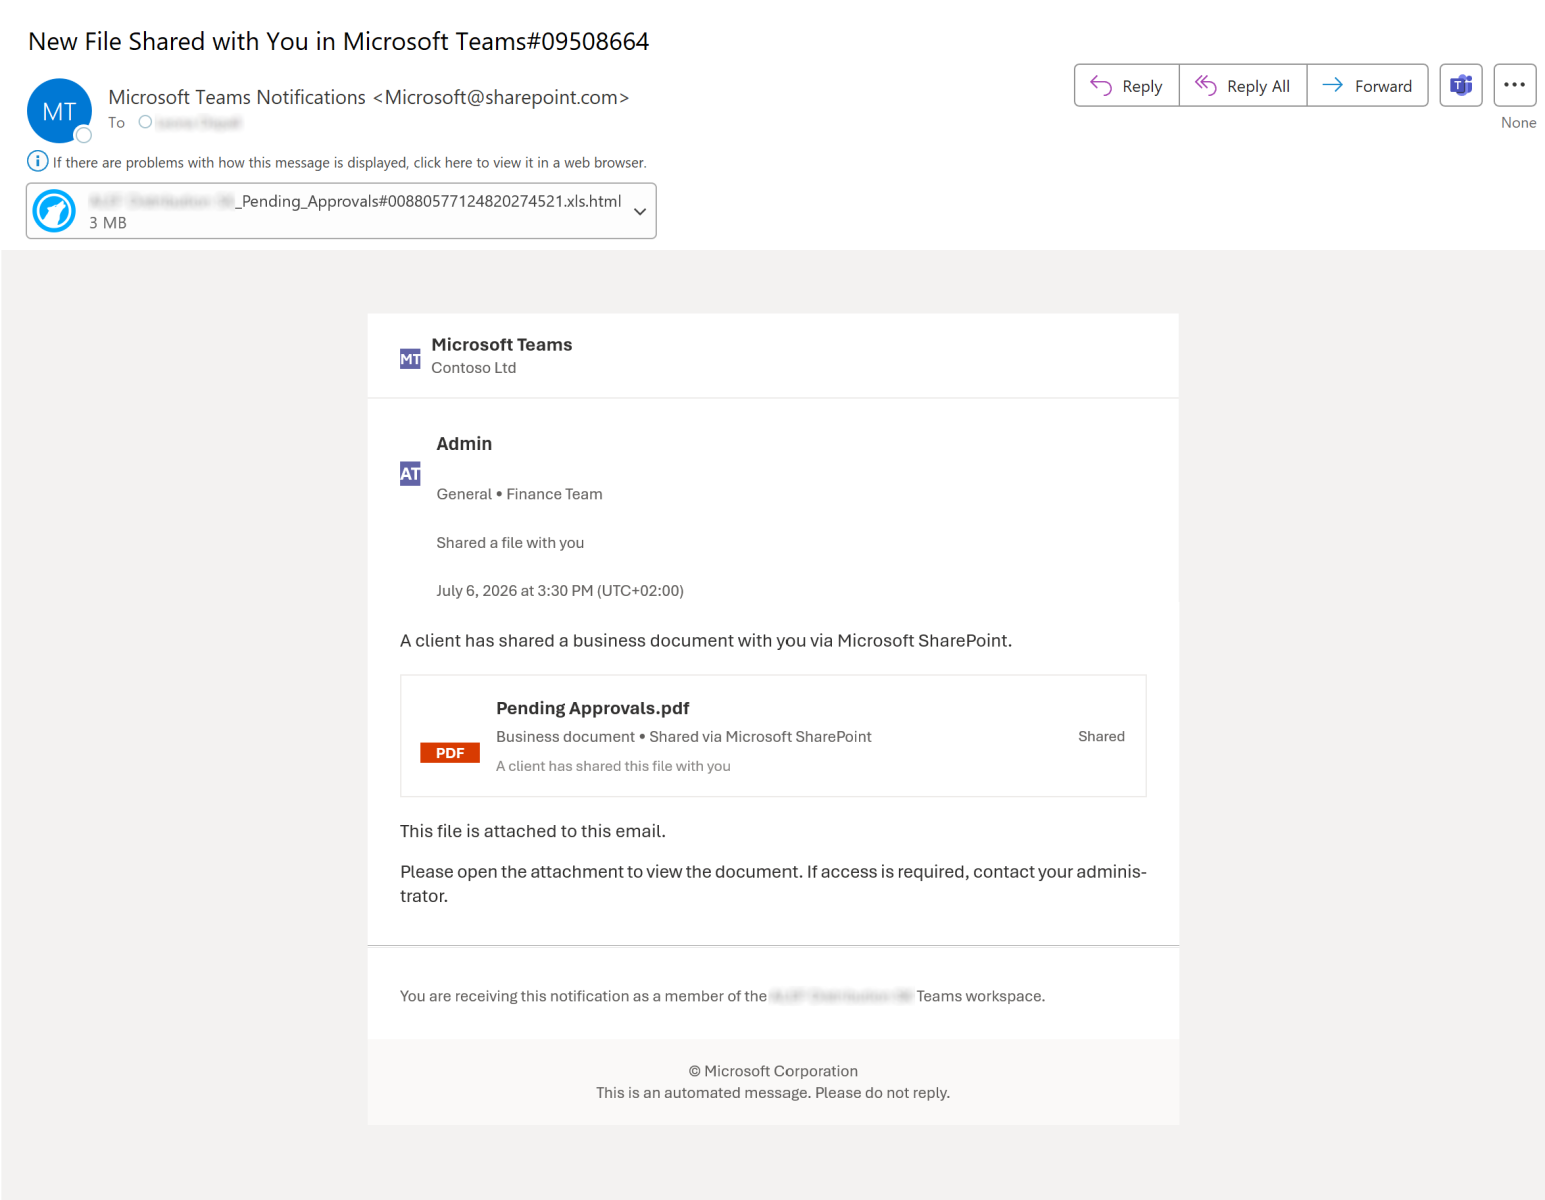
As you can see, the “From” header claimed that the message came from “Microsoft Teams Notifications <[email protected]>”. Unsurprisingly, this actually wasn’t the case…
When looking at the headers, three interesting points stood out:
- It turned out that the envelope sender was empty (i.e., “MAIL FROM:<>” was used). In principle, the use of an empty envelope sender – which is called a “null reverse-path” – is perfectly legitimate[1]. It is what bounce messages are supposed to use, so this was not a violation of any standard. It did, however, mean that there was no envelope domain against which SPF could be evaluated, which is why the receiving system fell back to the “HELO/EHLO” identity and ended up checking “postmaster@[10.88.0.3]” – i.e., an internal/RFC 1918 address presented by the sending host (which was actually hosted on the public IP 35.195.254.112 in the Google Cloud). Since we mentioned SPF, it is worth adding that no DKIM signature was present either (for obvious reasons), and that DMARC evaluation therefore unsurprisingly failed.
- The message carried no “Date” header whatsoever, which was the reason for the “None” date shown by Outlook. Unlike the empty envelope sender, this is against standardized requirements, as RFC 5322 requires an “origination date” field to be present[2]. A message put together by any normal e-mail client (or sent through a normal e-mail server) would essentially always have one, so its absence is telling.
- The “X-Priority” header was set to 0. This header was never formally standardized in an RFC, but per Microsoft’s specification[3], which is the de-facto authority for it, only the values 1 (highest) through 5 (lowest) are defined, so a “0” is outside the meaningful range.
While none of these oddities were especially remarkable on their own, taken together they painted a fairly clear picture of the tooling used to send the message – it was most likely a homemade script that interfaced directly with a receiving e-mail server and handed the message to it, without any standard e-mail server being involved on the sending end.
With that out of the way, let's take a closer look at the attachment.
The attached file was named “<name of company>_Pending_Approvals#<digits>.xls.html”, and its most immediately noticeable characteristic (besides the double extension) was its size. At 2,589 kB, it was significantly larger than one would expect a self-contained HTML phishing page to be, since these usually take up no more than a few tens (or at most hundreds – if images are included) of kilobytes.
The reason for this became clear as soon as the file was opened in a text editor. The entire contents were wrapped in a single layer of trivial obfuscation – the whole page was stored as a long sequence of “\uXXXX” escapes and handed to the “unescape()” JavaScript function inside a “document.write()” call.
<script type="text/javascript">document.write(unescape("\u003c\u0021\u0044\u004f\u0043\u0054\u0059\u0050\u0045\u0020\u0068\u0074\u006d
...
\u0058\u0058\u0058\u0058\u0058\u0058\u0058\u0058\u002d\u002d\u003e"));</script>
Once the escaped string was decoded, only 431 kB of HTML were left. Of that size, though, only the first 11 kB or so constituted an actual, working phishing page, while the remainder was padding. This padding was placed after the closing “</html>” tag and was made up of a single HTML comment containing a little over 430 thousand copies of the letter “X” (originally encoded as “\u0058”, which you can see above).
It is worth pointing out that the file size was, in effect, “inflated” twice over – first by the aforementioned ~420 kB comment, and then by the “\uXXXX” encoding, which stored each character (padding included) as six bytes. Between the two, the block of “X”s ended up accounting for something on the order of 2.5 MB, i.e., roughly 97 % of the entire file.
While phishing pages bloated with large quantities of copy-pasted, unused content are not new[4], in this case the padding is interesting because of what it might have plausibly been aimed at.
The classic reason for padding malicious files is covered by the MITRE ATT&CK “Obfuscated Files or Information: Binary Padding” sub-technique[5]. In short, threat actors may append a large, low-entropy blob to a file in order to push its size past the maximum that anti-malware engines are configured to scan, while keeping the file easy to compress (and therefore still convenient to deliver). While not as common as run-of-the-mill obfuscation, malware using this technique can be found in the wild reasonably often[6,7].
This sub-technique, however, does not quite fit our sample. Even leaving aside that the attachment is padded using a comment rather than a binary blob, at 2.5 MB the file falls well short of the scan-size limits used by present-day e-mail security solutions, which usually process attachments well into the tens of megabytes.
The padding is also about as low-entropy as any data can get, which means it wouldn’t help the file blend in with benign content on a statistical level either (if anything, a huge block of identical bytes would be trivial to spot and would make the file look more anomalous, not less). Whatever the padding is meant to defeat, in other words, it does not appear to be the sort of size or entropy-based checks that techniques traditionally used in phishing try to bypass…
One thing that has changed in the area of e-mail security over the past couple of years, though, is that a growing number of solutions have started to incorporate some form of NLP or AI-based mechanism for assessing message content, and this is where the padding might begin to make sense.
Earlier this year, KnowBe4 described a phishing technique they refer to as “NLP obfuscation”, in which malicious content is placed at the start of a message and then buried under a large amount of benign-looking filler[8]. According to their analysis, this can shift the “probability scale” that some content-classification models rely on – basically, if a message contains enough innocuous material, the weight of the malicious portion can be diluted to the point where the model no longer flags it with sufficient confidence. The same bulk can also make a message large enough so that scanning it using AI-based mechanisms takes too long, leading some solutions to release it rather than delay delivery indefinitely.
Although our attachment doesn’t fully match the samples described in the aforementioned analysis (the filler here is a single repeated character rather than natural-looking text) its overall structure (i.e. payload first, followed by filler) is the same.
If some form of AI or NLP-based content assessment was indeed the intended target, the padding would work not by disguising the “malicious” portion of the HTML file, but simply by drowning it out. Whether the message was scored by a traditional content classifier or passed to an actual LLM, the genuinely malicious portion would end up as a tiny fraction of a large, low-information whole, which might have been enough to pull an averaged or probability-based verdict below the threshold at which the message would be blocked. And since the bulk of the file carries no meaning, the same padding may serve a second, cruder purpose – inflating the sheer volume of data (and, for an LLM, the number of tokens) that has to be processed to the point where a scanner working under a per-message time or size budget would cut its analysis short, or skip it altogether[9].
Of the two, the second goal strikes me as the more likely one here. It is consistent with where the padding was placed – after the payload, where it does nothing to actually conceal the malicious portion of the HTML code – and it is the one objective for which a featureless block of “X” works just as well as carefully crafted filler, which would also explain why the author saw no need to use anything more elaborate.
I should stress that all of the above is, ultimately, only an informed speculation – short of asking the author of the phishing, there is no way to know for certain what they had in mind. It should also be said that, against any reasonably capable model, a solid block of a single repeated character would be a blunt instrument at best, since it is trivially recognizable as padding (see the entropy chart below).
For the sake of completeness, it should be mentioned that the functional part of the attachment was an otherwise unremarkable SharePoint-themed credential-harvesting page. It attempted to load the recipient organization’s logo dynamically through the Clearbit logo API, though, as the figure below shows, the lookup failed and a placeholder (image with Microsoft squares) was displayed instead… Which is unsurprising given that the free Clearbit logo API was shut down at the end of 2025[10] – this in itself is a small sign that the page was assembled from older, borrowed or LLM-generated code. Any credentials that were entered would be submitted through a POST request to the Formspark form-handling service[11], which was being misused as a convenient data collection point. The page additionally contained a routine that intercepted the developer-tools and view-source keyboard shortcuts – a trivial and fairly common anti-analysis feature[12].
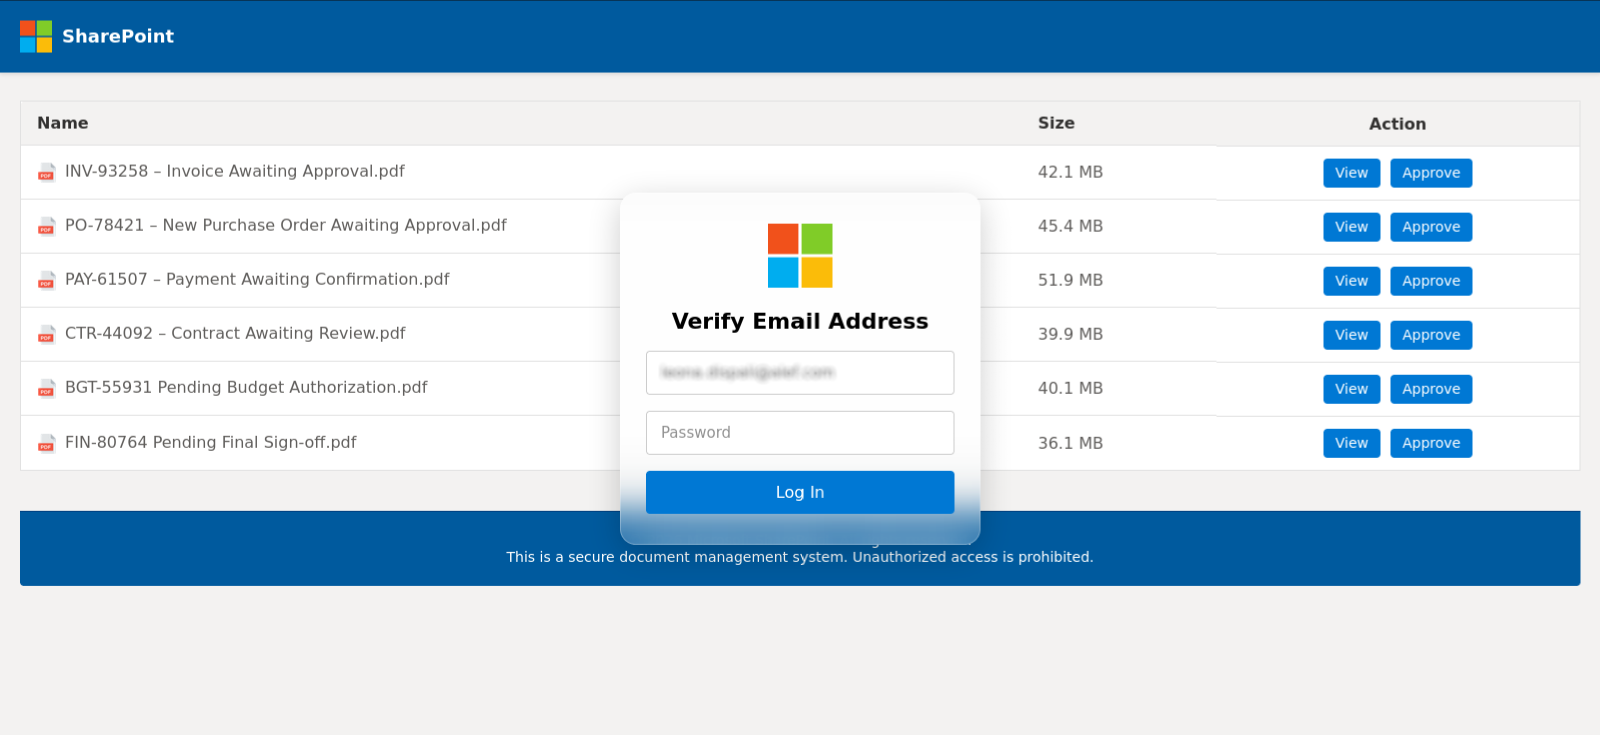
[1] https://datatracker.ietf.org/doc/html/rfc5321#section-4.5.5
[2] https://www.rfc-editor.org/rfc/rfc5322.html#section-3.6
[3] https://learn.microsoft.com/en-us/openspecs/exchange_server_protocols/ms-oxcmail/2bb19f1b-b35e-4966-b1cb-1afd044e83ab
[4] https://isc.sans.edu/diary/32510
[5] https://attack.mitre.org/techniques/T1027/001/
[6] https://isc.sans.edu/diary/26464
[7] https://isc.sans.edu/diary/30524
[8] https://blog.knowbe4.com/nlp-obfuscation-techniques-email-security-evasion
[9] https://genai.owasp.org/llmrisk2023-24/llm04-model-denial-of-service/
[10] https://developers.hubspot.com/changelog/upcoming-sunset-of-clearbits-free-logo-api
[11] https://formspark.io/
[12] https://isc.sans.edu/diary/30412
-----------
Jan Kopriva
LinkedIn
Nettles Consulting
0 Comments
My Stack Simulator
The stack is a memory region where a program stores temporary data - like local variables and return addresses. Think of the stack as a pile of plates in your kitchen: you can only add a new plate to the top, and you can only take one away from the top too. Programs use this same "last in, first out" principle to keep track of what they're doing. Every time a function is called, the program pushes a new plate onto the stack containing things like local variables and the address to return to once the function finishes. When the function is done, that plate is popped off the top, and execution resumes exactly where it left off. This simple mechanism is what allows programs to call functions within functions, and always find their way back - but it's also precisely why a stack that grows too large, or gets overwritten with unexpected data, becomes a favorite target for attackers looking to hijack a program's execution flow.
In the SANS class FOR610[1] (malware analysis), there is an introduction to assembly and, when students learn how functions work, they have to understand how the stack also works. If you’ve no prior experience, it could be a bit challenging. To help students to vizualise how the stack works, I created a “stack simulator” that allows to “see” what’s happening when code is executed.
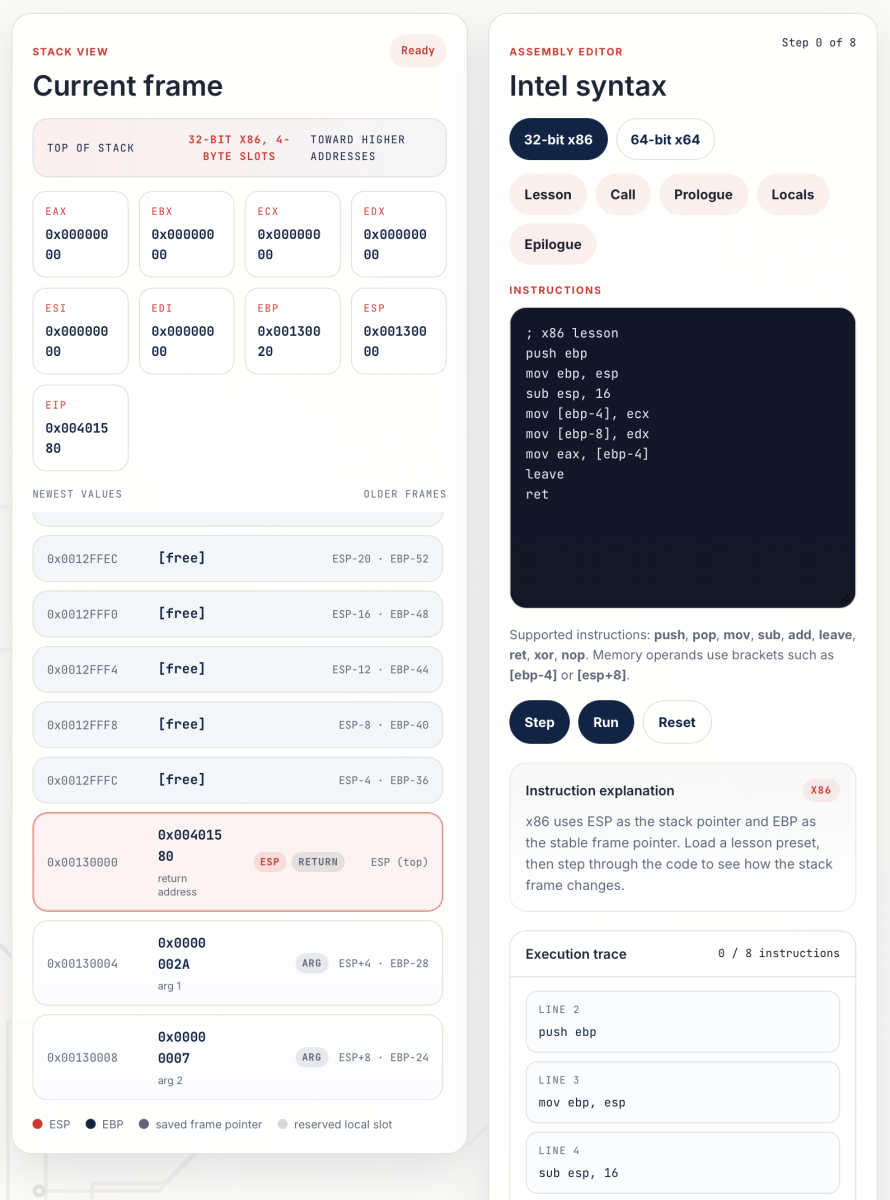
How does it work?
- Select the architecture (32-64 bits) in the assembly editor
- Select a predefined set of instructions (“lesson”, “call”, “prologue”, …).
- Click on “Step” to you can see the impact on the stack and registers (like in a debugger).
Note that you can modify the predefined ASM code and add your own instructions.
The stack simulator is available on my website[2].
If you’re interested in malware analysis, my next classes will be:
[1] https://www.sans.org/cyber-security-courses/reverse-engineering-malware-malware-analysis-tools-techniques
[2] https://xameco.be/stack-simulator.html
[3] https://www.sans.org/cyber-security-training-events/tokyo-autumn-2026
[4] https://www.sans.org/cyber-security-training-events/paris-november-2026
Xavier Mertens (@xme)
Xameco
Senior ISC Handler - Freelance Cyber Security Consultant
PGP Key
0 Comments
_HELP_ME_ESCAPE_FROM_BELARUS_PLEASE_ [Guest Diary]
[This is a Guest Diary by Jason Callahan, an ISC intern as part of the SANS.edu BACS program]
Every so often a honeypot hit comes along that is less about the exploit and more about the intent behind it. While reviewing DShield logs I ran into a scanning bot that caught my eye: a URI string that appeared to be a plea for help.
On 2026-06-06 my DShield honeypot logged back-to-back HTTP requests from the same source IP hitting two different ports with both carrying an identical, oddly formatted request path:
.png)
The request path itself /?_HELP_ME_ESCAPE_FROM_BELARUS_PLEASE_ is not a known exploit path, it appeared to be a plain-text message in the URL. Searching my logs for that particular string returned around a dozen similar HTTP requests over a 2 months period. These came from various IPs from around the globe with no discernible pattern which pointed to a self-propagating bot rather than a single attacker.
Further research showed that this bot was first reported to ISC in May 2026. The number of reports peaked shortly after the first report before a sharp drop and has remained steady since. [1]
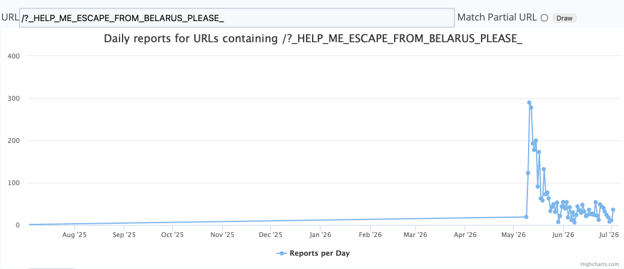
I was unable to locate much more information about this bot other than a reddit thread on r/selfhosted describing the same requests hitting a Traefik reverse proxy. According to that thread, the user emailed the address embedded in the User-Agent and received a reply pointing to a page on a free web-hosting service. The page is a static HTML document with no scripts and it lays out what the bot is & why it exists.
The author, who identifies himself only as “Alex,” claims to be based in Belarus and writes that the bot is intentionally limited: no exploits, no command-and-control, no persistence. In his words, paraphrased and summarized from the page:
• The bot scans random IP addresses for open HTTP ports (80, 8000, 8080) and SSH ports (22, 2222).
• If it finds an open HTTP port it sends a single request (GET, CONNECT, or HEAD)
• If it finds an open SSH port it attempts a brute force with a small, fixed list of default credential pairs (admin:admin, root:root, etc.)
• It runs fully autonomously with no C2 channel; discovered IP/credential pairs are reported back to a loader only.
• It does not establish persistence, typically running from /tmp, and it is designed to self-terminate roughly six months after release.
• The stated purpose is to draw attention to conditions in Belarus. They describe it as a “performance piece,” saying they are not seeking funding and only asking for non-financial help leaving the country (job leads, advice, connections).
Disregarding the origin and supposed intent of the bot, this is a straightforward scan-and-brute-force bot and it should be treated like any other hitting a honeypot. The HTTP request is reconnaissance/fingerprinting that tells the operator a host is alive and reachable on that port. The risk is on the SSH side: any host reachable on TCP 22/2222 that still uses a default or weak credential pair is exposed, regardless of the creator’s stated intentions.
I want to give some healthy skepticism here rather than take the linked page at face value. I have no way to verify the age, location, or motive claimed on that page, whether the page itself is the full extent of the bot's behavior, or whether the “self-terminate after six months” and “no persistence” claims hold up under closer reverse engineering. Sob stories and appeals to sympathy are also a known social-engineering lever, and a URI designed to make analysts pause and read a web page rather than immediately blocklist an IP is an effective way to buy a scanner some goodwill. None of that changes the defensive posture: treat it as an untrusted, credential-guessing scanner.
[1] https://isc.sans.edu/weblogs/urlhistory.html?url=Lz9fSEVMUF9NRV9FU0NBUEVfRlJPTV9CRUxBUlVTX1BMRUFTRV8=
[2] https://isc.sans.edu/honeypot.html
[3] https://www.sans.edu/cyber-security-programs/bachelors-degree/
Disclosure: Claude was used for grammar and polish checks. No further use of generative A.I. was used in the creation of this post.
-----------
Guy Bruneau IPSS Inc.
My GitHub Page
Twitter: GuyBruneau
gbruneau at isc dot sans dot edu
0 Comments
More Odd DNS Records: NIMLOC
Yesterday, I talked about NAPTR records and how they are related to RCS. But there is another "odd" record that shows up in my DNS logs. This one isn't new, but I don't think I ever covered it: NIMLOC. At least that is what Zeek calls it. But let's see what it is all about.
At first, it looks like NIMLOC records are no longer used. Google's AI overview explains: "A NIMLOC (Nimrod Locator) DNS record is an obsolete resource record type (Type 32) originally designed for the Nimrod routing architecture to map names to network locators. Because Nimrod was an experimental protocol, NIMLOC records are considered historic and are not used in modern, standard network operations."
While I do have one or the other odd IOT device in my network, I doubt any of them speak "Nimrod". On the other hand, the queries originate from my macOS systems. This turns out to be an older standard, replaced by a newer (but still old) standard, with the newer standard becoming obsolete before the even older standard is phased out.
DNS defines several resource record types. The official list is maintained by IANA [1] and I am including a sample below:
| TYPE | Value | Meaning | References |
| A | 1 | IPv4 Address | RFC1035 |
| NS | 2 | Name Server | RFC1035 |
| PTR | 12 | Domain Name Pointer | RFC1035 |
| MX | 15 | Mail Server | RFC1035 |
| TXT | 16 | Text String | RFC1035 |
| AAAA | 28 | IPv6 Address | RFC3596 |
| NIMLOC | 32 | Nimrod Locator | (no RFC) |
| SRV | 33 | Server Selection | RFC2782 |
| NAPTR | 35 | Naming Authority Pointer | RFC3403 |
There is a range of unassigned RR types, so one would think that it is not necessary to reuse RR Types. But this is exactly what happened here.
RR Type 32 was originally assigned for the old NetBIOS over TCP/UDP (RFC 1002, [2]). This actually became one of the few Internet Standards (STD 19). RR Type 32 is assigned ot "NB" (NetBIOS General Name Service) and 33 to "NBSTAT", the NetBIOS Node Status. If you search for it in the RFC, look for the hex values 0x0020 and 0x0021 (took me a while to find them).
NetBIOS is long gone, and modern Windows networks use DNS and SMB over TCP, eliminating the NetBIOS layer. But macOS is still holding on to it and broadcasting name announcements on port 137 using these records. Zeek (which I used to collect the logs), translates RR Type 32 to "NIMLOC", which conforms to the current IANA assignment for this type. But in reality, you are probably going to see NetBIOS and not the never-quite-implemented Nimrod routing scheme.
[1] https://www.iana.org/assignments/dns-parameters/dns-parameters.xhtml#dns-parameters-4
[2] https://www.rfc-editor.org/info/rfc1002/
--
Johannes B. Ullrich, Ph.D. , Dean of Research, SANS.edu
Twitter|
0 Comments
RCS and DNS: The NAPTR Record
Over the last year, with recent updates to iOS and Android, RCS (Rich Communication Services) has become an increasingly used protocol [1]. RCS is supposed to eventually replace SMS, and in addition to richer formatting, provides added (but optional) security. RCS messages may be end-to-end encrypted and digitally signed. Unlike SMS, which was "bolted on" to existing voice-focused phone standards. The SMS standard was based on old-fashioned pagers and allowed for limited clear-text communications. RCS is built from the ground up around modern IP-based network infrastructure and behaves more like IP chat services (think iMessage, WhatsApp...). RCS defines the message format, while protocols like SIP are used to establish connections and transport messages.
"Do as you say", I do from time to time take a look at odd DNS traffic on my network. An activity I recommend when teaching SEC503. Recently, I noticed more "NAPTR" queries, a record type I had not seen before. The record type is defined in RFC 2915 [2], which was ratified in 2000. It is not a new record. But so far, at least in my network, it has not really shown up before.
The description of the record sounds rather ominous:
"a Resource Record that included a regular expression that would be used by a client program to rewrite a string into a domain name."
Wow. Regular expressions to rewrite resource records? What could possibly go wrong? However, right now, I just want to talk about how it "goes right" and how these records are currently being used for RCS.
Below is the relevant part of the t-shark decode of a record typical for what I have seen in my network:
Queries
fp-us-verizon.rcs.telephony.goog: type NAPTR, class IN
Name: fp-us-verizon.rcs.telephony.goog
[Name Length: 32]
[Label Count: 4]
Type: NAPTR (35) (Naming Authority Pointer)
Class: IN (0x0001)
Answers
fp-us-verizon.rcs.telephony.goog: type NAPTR, class IN, order 100, preference 100, flags s
Name: fp-us-verizon.rcs.telephony.goog
Type: NAPTR (35) (Naming Authority Pointer)
Class: IN (0x0001)
Time to live: 295 (4 minutes, 55 seconds)
Data length: 61
Order: 100
Preference: 100
Flags Length: 1
Flags: s
Service Length: 8
Service: SIPS+D2T
Regex Length: 0
Regex:
[Replacement Length: 43]
Replacement: _sips._tcp.fp-us-verizon.rcs.telephony.goog
This was the only applicable NAPTR record, so order and preference do not matter in this case. The "S" flag indicates that the next lookup should be a SRV record. And indeed, we do have a SRV query (see below). Only a "U" flag would result in a URI.
Remember that this record is about URIs, not IP addresses? The "Service" field indicates what service we may find at the to-be-determined URI. In this case, it is SIPS+D2T. SIPS+D2T is a transport protocol defined in the SIP standard (RFC 3263). SIPS+D2T stands for "Secure SIP Direct to TCP". So we will be using SIP over TLS with TCP as the transport protocol. The SIP standard specifically calls for NAPTR records to find SIP servers. The reason for the NAPTR record is to allow URIs to be returned, not just IP addresses/hostnames (as an SRV record would).
Lucky for us (and the DNS server), the regular expression is empty. And this appears to be normal for this use case. Instead, we just get a "SRV" record to request:
Queries???????
_sips._tcp.fp-us-verizon.rcs.telephony.goog: type SRV, class IN
Name: _sips._tcp.fp-us-verizon.rcs.telephony.goog
[Name Length: 43]
[Label Count: 6]
Type: SRV (33) (Server Selection)
Class: IN (0x0001)
Answers
_sips._tcp.fp-us-verizon.rcs.telephony.goog: type SRV, class IN, priority 20, weight 0, port 5223, target fp-us-verizon.rcs.telephony.goog
Service: _sips
Protocol: _tcp
Name: fp-us-verizon.rcs.telephony.goog
Type: SRV (33) (Server Selection)
Class: IN (0x0001)
Time to live: 300 (5 minutes)
Data length: 40
Priority: 20
Weight: 0
Port: 5223
Target: fp-us-verizon.rcs.telephony.goog
_sips._tcp.fp-us-verizon.rcs.telephony.goog: type SRV, class IN, priority 30, weight 0, port 443, target fp-us-verizon.rcs.telephony.goog
Service: _sips
Protocol: _tcp
Name: fp-us-verizon.rcs.telephony.goog
Type: SRV (33) (Server Selection)
Class: IN (0x0001)
Time to live: 300 (5 minutes)
Data length: 40
Priority: 30
Weight: 0
Port: 443
Target: fp-us-verizon.rcs.telephony.goog
And yes, in the end, there is a "normal" A and AAAA lookup for fp-us-verizon.rcs.telephony.goog.
So far, NAPTR records do not appear to be used to their full potential. I am sure that the use of regular expressions will be of interest to bug hunters and penetration testers.
[1] https://support.google.com/messages/answer/13508703?hl=en
[2] https://www.ietf.org/rfc/rfc2915.txt
--
Johannes B. Ullrich, Ph.D. , Dean of Research, SANS.edu
Twitter|
0 Comments
Why Ask Credentials If There Are Secret Codes?
This morning, an interesting phishing email hit my mailbox. It targets Metamask[1], a cryptocurrency wallet, available as a browser extension and a mobile app, that lets users store, send, and receive crypto money. It’s pretty popular, so a juicy target for criminals. In February, I already mentioned a campaign against them[2].
Today’s email was different and used another approach. Most services that we use daily ask us to implement a 2nd authentication factor. That makes simple credentials useless if you can’t interact with the victim and grab the temporary token, code, …
But most services also offer a “password recovery” process. In the case of Metamask, it’s based on your secret security phrase that you created during the account creation process[3]. That’s exactly the target of this phishing campaign. They ask you to provide this secret phrase.
First, they put some pressure on you, pretending that your wallet is at risk:
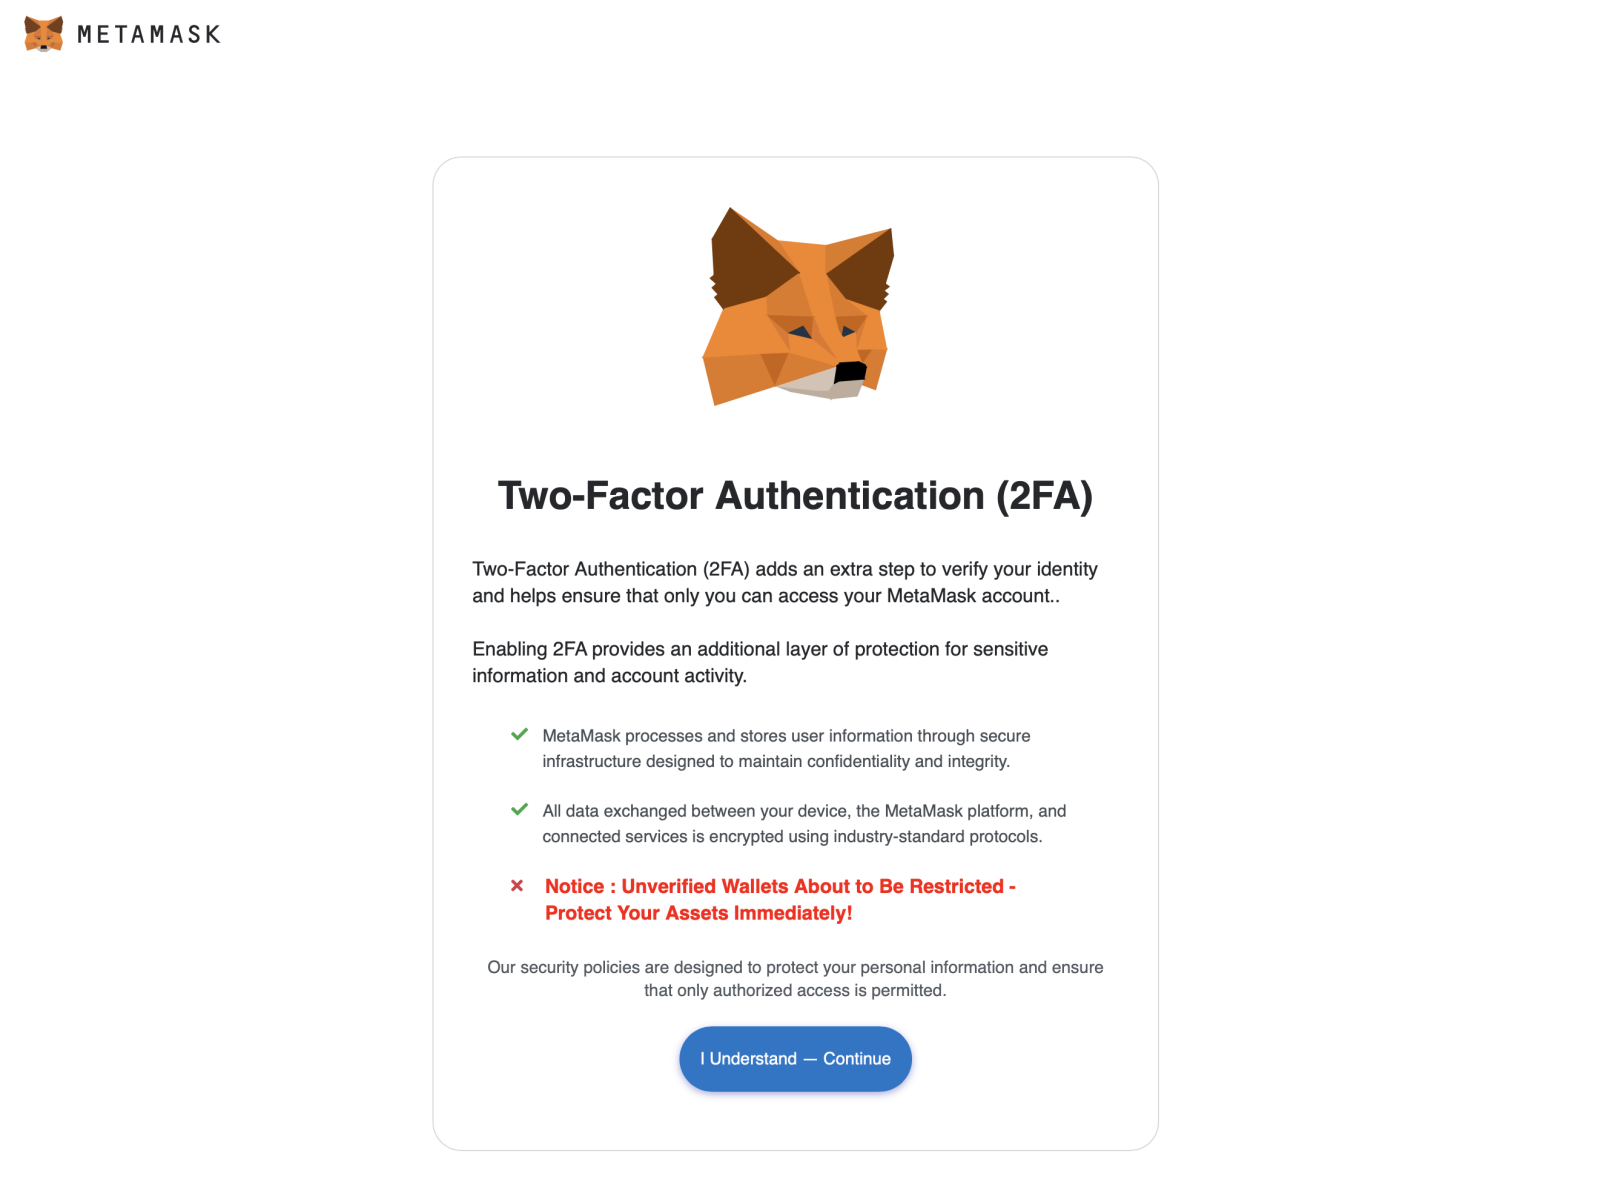
Then, they ask you to provide your secret phrase:
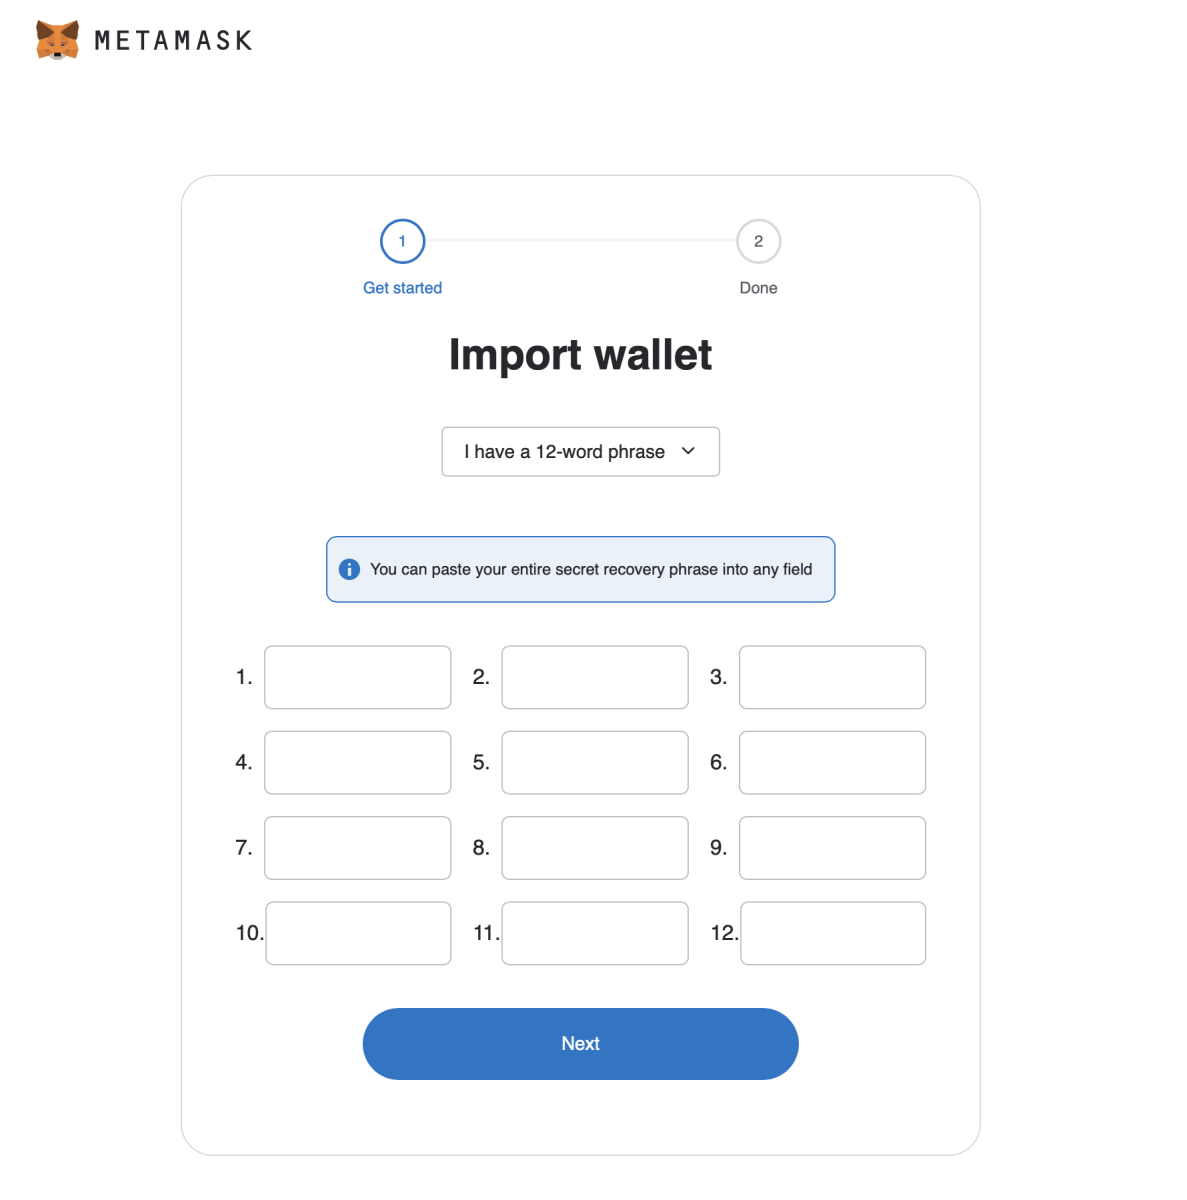
The campaing relies on the domain captchasolve[.]help that has been registered two days ago.
[1] https://metamask.io
[2] https://isc.sans.edu/diary/Fake+Incident+Report+Used+in+Phishing+Campaign/32722
[3] https://support.metamask.io/configure/wallet/how-can-i-reset-my-password/
Xavier Mertens (@xme)
Xameco
Senior ISC Handler - Freelance Cyber Security Consultant
PGP Key
0 Comments


0 Comments