Recent DShield SIEM Update
The last update to the DShield SIEM [4] was in Sep 2025 which contained some minor tweaks. This update currently is using ELK stack version 8.19.15, contains some additional dashboards and new logs.
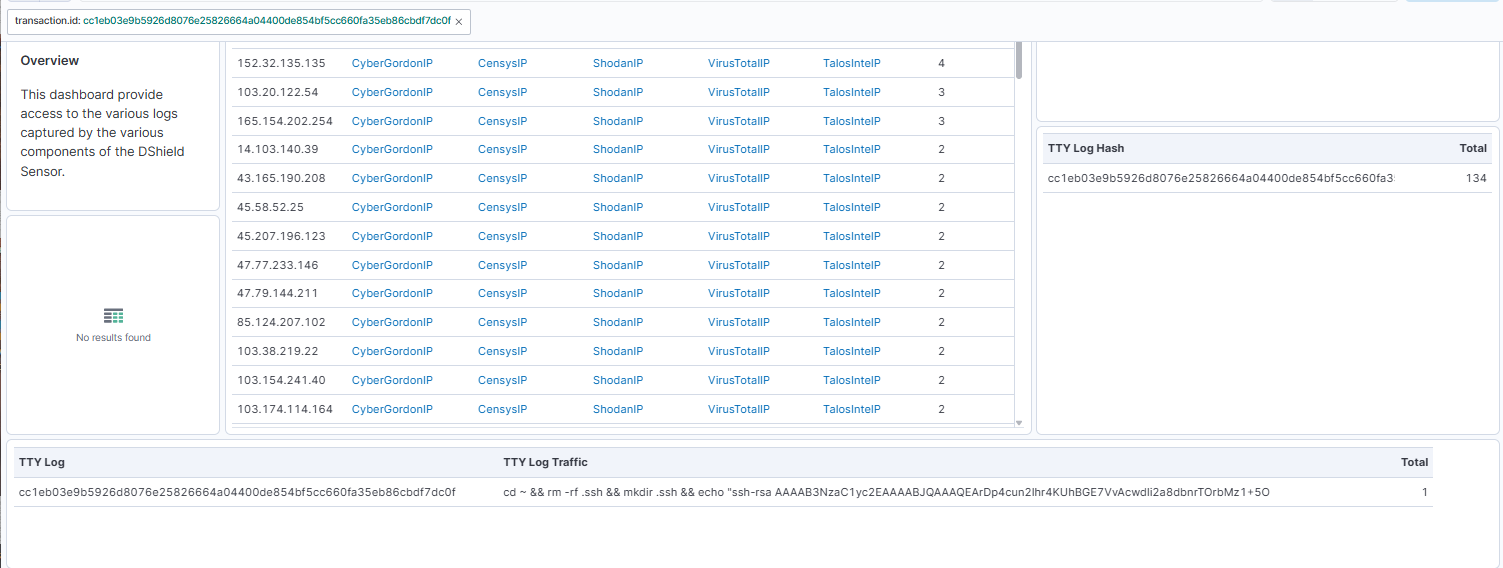
The following have been added to the DShield SIEM to provide additional information about what the DShield sensor [1] is receiving. These 2-addition installed in the DShield sensor provide direct collection of TTY logs [2] and Suricata [3] which are now reported to the DShield SIEM. The TTY logs are parsed and uploaded daily at 23:58Z which can be reviewed in the DShield - Traffic Analysis tab to match the TTY Log Hashes and shows which actor ran any series of commands while logged in the sensor.
The TTY logs are base64 encoded before they are sent to the SIEM and decoded by Kibana upon review. TTY logs in base64 format:
transaction.id: 021d88f11b09defc8756e1bd6eabaea8113b3fbf917c9bd4fef4f546a1c9512a
event.hash: ZWNobyAtZSAieCFcbjBPc0NsT21WU0JGOVxuME9zQ2xPbVZTQkY5InxwYXNzd2R8YmFzaC1iYXNoOiBFbnRlcjogY29tbWFuZCBub3QgZm91bmQK
transaction.id: 02caa940d3e30057af8235125c8376b2394622118344516895b045a6fe9b5ecb
event.hash: ZWNobyAtZSAiMTIzXG53QjV1clY4NXFxa1dcbndCNXVyVjg1cXFrVyJ8cGFzc3dkfGJhc2gtYmFzaDogRW50ZXI6IGNvbW1hbmQgbm90IGZvdW5kCg==
transaction.id: 052b36a73707754c7d49814cdc1f32fef3f72d334a7479f78f11c3229c1599d9
event.hash: ZWNobyAtZSAieCFcbkNLbGFOS0lOdWlYalxuQ0tsYU5LSU51aVhqInxwYXNzd2R8YmFzaC1iYXNoOiBFbnRlcjogY29tbWFuZCBub3QgZm91bmQK
The TTY logs are parsed once per day and uploaded directly into DShield SIEM with filebeat. The BASH script needs to be installed and configure according to the GitHub page [2] to provide a transcript of the activity reviewed in Kibana.
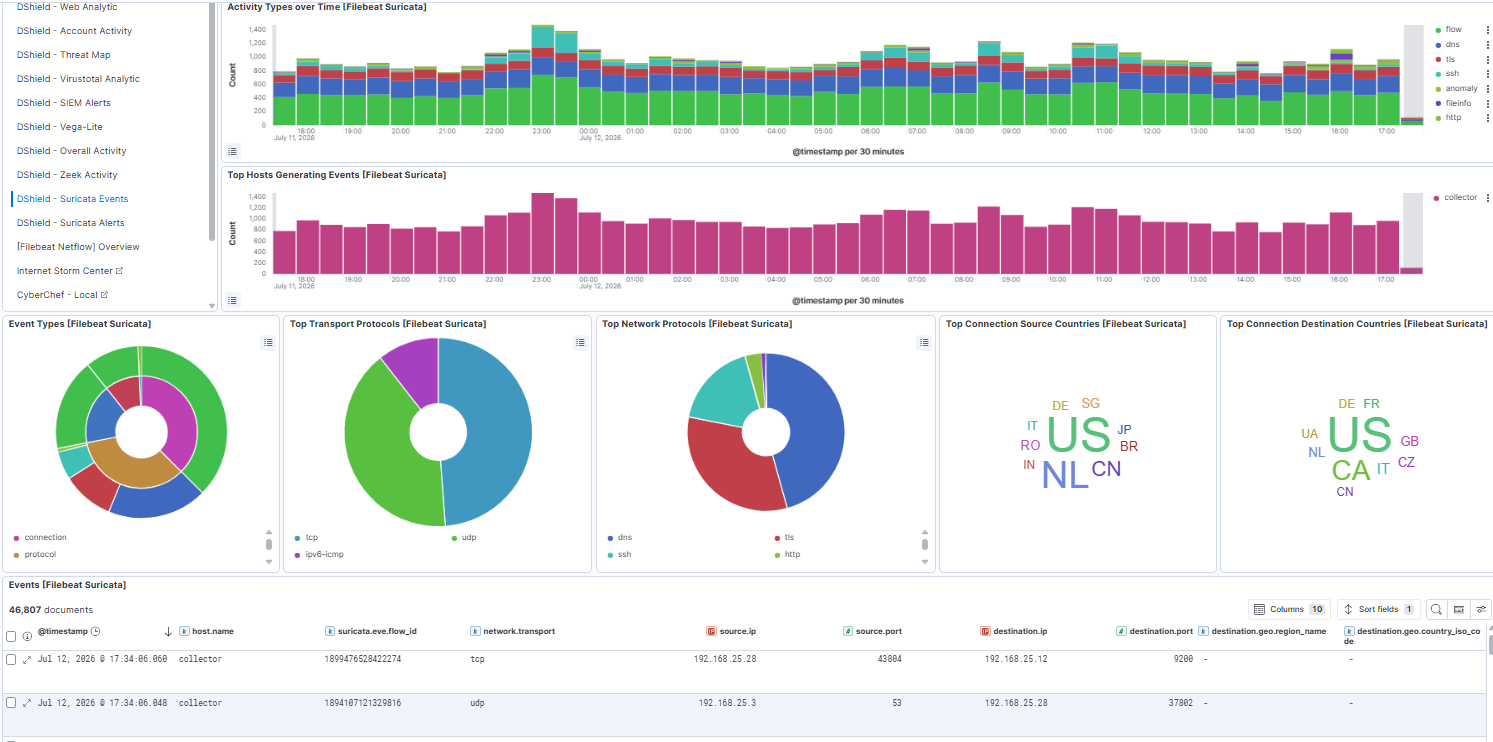
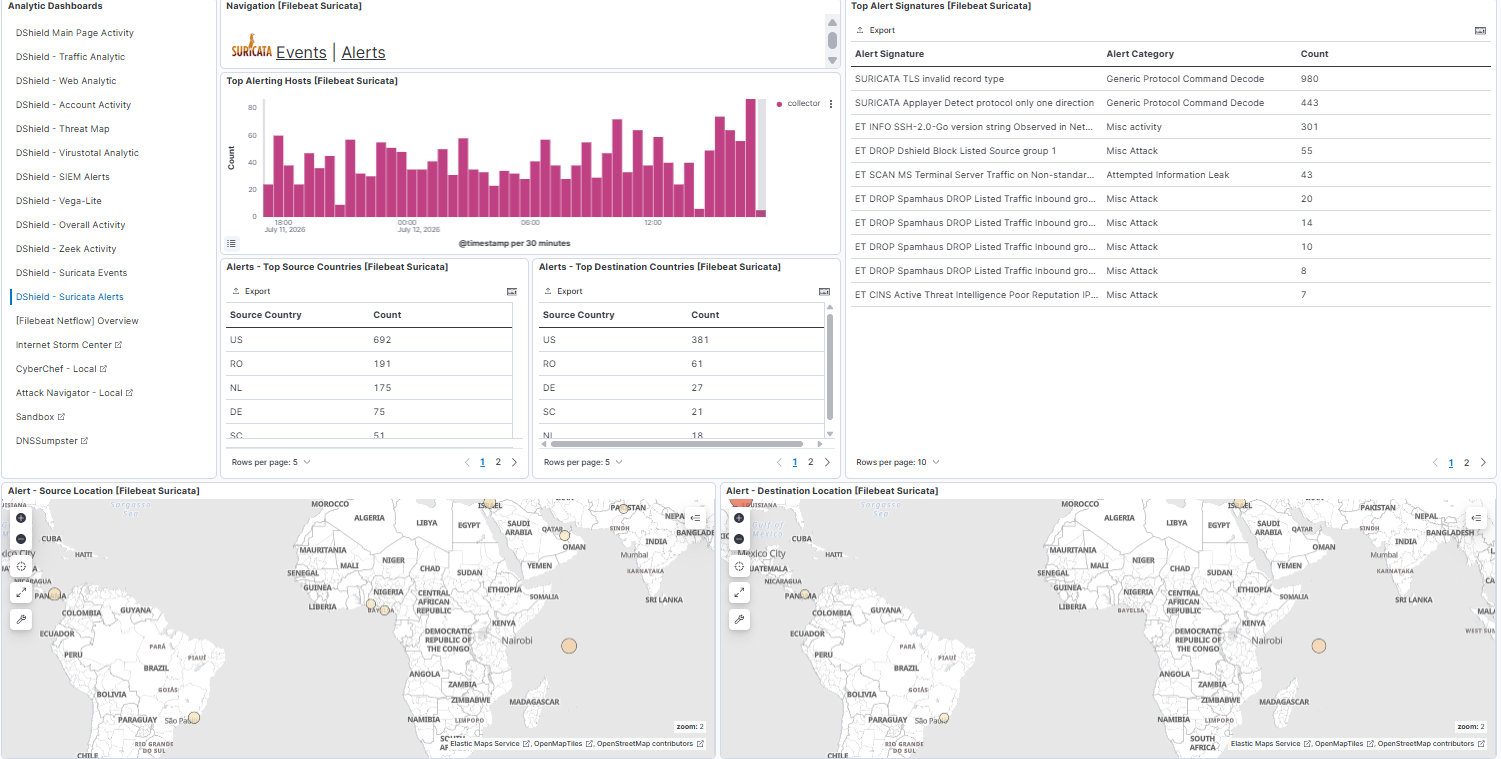
The addition of Suricata [3] is also available in the DShield dashboards and linked to all other logs.
An updated dashboard now contains these changes to reflect the ability to share between sub-dashboard most of the queries selected (i.e. selecting an IP will replicate everywhere).
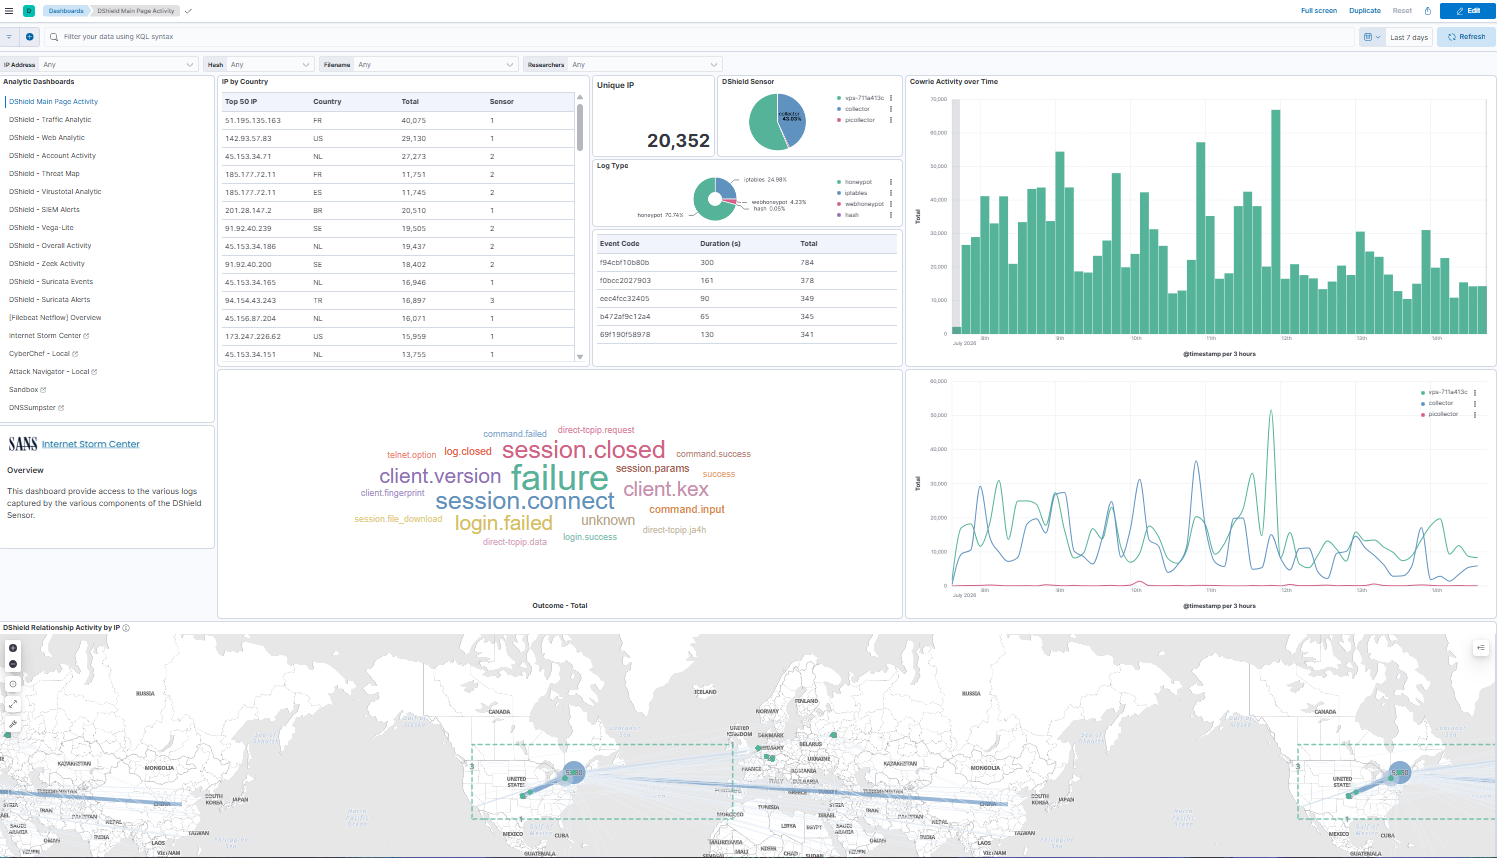
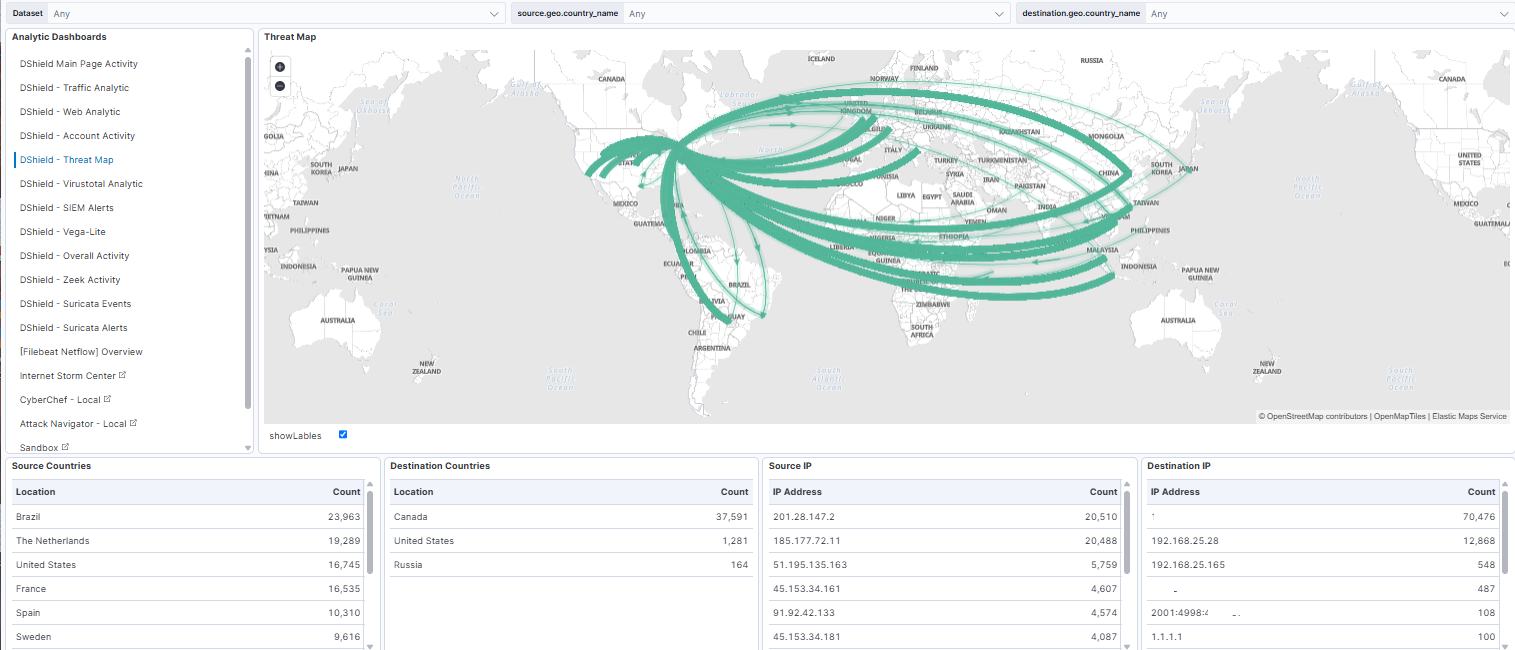
The dashboard also has a Threat Map that can be used to view the logs traffic activity in "movement".
Jesse and I are at SANSFIRE, if you are onsite, come tonight at the SANSFIRE 2026 Honeypot Workshop in Independence A - West (Level 5B) at 6:45 PM.
[1] https://isc.sans.edu/honeypot.html
[2] https://github.com/bruneaug/DShield-SIEM/blob/main/AddOn/TTYLogs_To_DShield-SIEM.md
[3] https://github.com/bruneaug/DShield-SIEM/blob/main/AddOn/Configure_Suricata.md
[4] https://isc.sans.edu/diary/DShield+SIEM+Docker+Updates/32276
[5] https://github.com/bruneaug/DShield-SIEM/tree/main
-----------
Guy Bruneau IPSS Inc.
My GitHub Page
Twitter: GuyBruneau
gbruneau at isc dot sans dot edu
Microsoft Patch Tuesday July 2026 - The AI Acopolypse is Here
This patch Tuesday includes a staggering 622 vulnerabilities, not including another 427 vulnerabilities in Chromium, affecting Microsoft's Edge browser. 62 of the vulnerabilities are rated critical. One was disclosed before today, and two have already been exploited.
Given the large number of vulnerabilities, it is difficult to point out "noteworthy" issues.
Already exploited vulnerabilities:
CVE-2026-56155 : Active Directory Federation Services Elevation of Privilege Vulnerability. This is an important (not critical) vulnerablity.
CVE-2026-56164: Microsoft SharePoint Server Elevation of Privilege Vulnerability. Microsoft considers this vulnerability's severity only moderate.
Disclosed but not yet exploited:
CVE-2026-50661: Windows BitLocker Security Feature Bypass Vulnerability. It is not clear right now if this is one of the Nightmare Eclipse vulnerabilities. "Anonymous" is credited with discovering the vulnerability.
Random Interesting Vulnerabilities:
CVE-2026-54128: Windows DHCP Client Remote Code Execution Vulnerability. A critical vulnerability, but it will require the victim to connect to a network exposed to a malicious DHCP server. Certainly interesting for "public wifi network" attacks. There are also a few critical DHCP server RCE vulnerabilities being addressed in this update.
CVE-2026-54982, CVE-2026-54995: Windows Reliable Multicast Transport Driver (RMCAST) Remote Code Execution Vulnerability. Two critical vulnerabilities. Just like DHCP, the exploit will typically require network-adjacent attackers. I have seen several similar vulnerabilities in MSFT updates in the past, but not seen exploits.
A quick word on how to deal with this flood of new vulnerabilities: You still own the same number of Microsoft products. Many products (Office..) are affected by a large number of vulnerabilities. Patching the product should not take a lot more time just because the patch addresses more vulnerabilities.
| Description | |||||||
|---|---|---|---|---|---|---|---|
| CVE | Disclosed | Exploited | Exploitability (old versions) | current version | Severity | CVSS Base (AVG) | CVSS Temporal (AVG) |
| .NET Denial of Service Vulnerability | |||||||
| CVE-2026-47302 | No | No | - | - | Important | 7.5 | 6.5 |
| CVE-2026-50525 | No | No | - | - | Important | 7.5 | 6.5 |
| CVE-2026-50651 | No | No | - | - | Important | 7.5 | 6.5 |
| CVE-2026-57108 | No | No | - | - | Important | 7.5 | 6.5 |
| .NET Framework Denial of Service Vulnerability | |||||||
| CVE-2026-50524 | No | No | - | - | Important | 7.5 | 6.5 |
| CVE-2026-50527 | No | No | - | - | Important | 7.5 | 6.5 |
| CVE-2026-50648 | No | No | - | - | Important | 7.5 | 6.5 |
| .NET Framework Elevation of Privilege Vulnerability | |||||||
| CVE-2026-50650 | No | No | - | - | Important | 7.8 | 6.8 |
| .NET Framework Remote Code Execution Vulnerability | |||||||
| CVE-2026-50646 | No | No | - | - | Important | 7.8 | 6.8 |
| .NET Remote Code Execution Vulnerability | |||||||
| CVE-2026-50649 | No | No | - | - | Important | 7.8 | 6.8 |
| .NET Security Feature Bypass Vulnerability | |||||||
| CVE-2026-47304 | No | No | - | - | Important | 8.1 | 7.1 |
| CVE-2026-50528 | No | No | - | - | Important | 8.2 | 7.1 |
| .NET Spoofing Vulnerability | |||||||
| CVE-2026-50659 | No | No | - | - | Important | 6.5 | 5.7 |
| .NET Tampering Vulnerability | |||||||
| CVE-2026-50526 | No | No | - | - | Important | 7.0 | 6.1 |
| ASP.NET Core Denial of Service Vulnerability | |||||||
| CVE-2026-56170 | No | No | - | - | Important | 7.5 | 6.5 |
| ASP.NET Core Elevation of Privilege Vulnerability | |||||||
| CVE-2026-47300 | No | No | - | - | Important | 8.8 | 7.7 |
| CVE-2026-47303 | No | No | - | - | Important | 8.8 | 7.7 |
| Active Directory Certificate Services Elevation of Privilege Vulnerability | |||||||
| CVE-2026-54121 | No | No | - | - | Critical | 8.8 | 7.7 |
| Active Directory Denial of Service Vulnerability | |||||||
| CVE-2026-50682 | No | No | - | - | Important | 7.1 | 6.2 |
| Active Directory Domain Services Elevation of Privilege Vulnerability | |||||||
| CVE-2026-55001 | No | No | - | - | Important | 7.8 | 6.8 |
| Active Directory Federation Server Denial of Service Vulnerability | |||||||
| CVE-2026-50647 | No | No | - | - | Important | 7.5 | 6.5 |
| Active Directory Federation Server Spoofing Vulnerability | |||||||
| CVE-2026-50684 | No | No | - | - | Important | 4.8 | 4.2 |
| Active Directory Federation Services Elevation of Privilege Vulnerability | |||||||
| CVE-2026-56155 | No | Yes | - | - | Important | 7.8 | 7.2 |
| Azure Active Directory Denial of Service Vulnerability | |||||||
| CVE-2026-50652 | No | No | - | - | Important | 7.5 | 6.5 |
| CVE-2026-50653 | No | No | - | - | Important | 7.5 | 6.5 |
| Azure CycleCloud Elevation of Privilege Vulnerability | |||||||
| CVE-2026-57969 | No | No | - | - | Important | 8.8 | 7.7 |
| CVE-2026-58279 | No | No | - | - | Important | 6.5 | 5.9 |
| Azure Monitor Agent Metrics Extension Elevation of Privilege Vulnerability | |||||||
| CVE-2026-47632 | No | No | - | - | Important | 8.8 | 7.7 |
| Azure OpenAI Elevation of Privilege Vulnerability (no customer action required) |
|||||||
| CVE-2026-45499 | No | No | - | - | Critical | 9.9 | 8.6 |
| Azure Spring Apps Elevation of Privilege Vulnerability | |||||||
| CVE-2026-50338 | No | No | - | - | Important | 8.2 | 7.4 |
| CVE-2026-13862 | |||||||
| CVE-2026-13862 | No | No | - | - | - | ||
| Clipboard User Service Elevation of Privilege Vulnerability | |||||||
| CVE-2026-50488 | No | No | - | - | Important | 7.8 | 6.8 |
| Code Integrity DLL (ci.dll) Elevation of Privilege Vulnerability | |||||||
| CVE-2026-50491 | No | No | - | - | Important | 7.0 | 6.1 |
| Composite Image File System driver (cimfs.sys) Information Disclosure Vulnerability | |||||||
| CVE-2026-50381 | No | No | - | - | Important | 5.5 | 4.8 |
| Content Delivery Manager Elevation of Privilege Vulnerability | |||||||
| CVE-2026-50427 | No | No | - | - | Important | 7.8 | 6.8 |
| DHCP Server Service Remote Code Execution Vulnerability | |||||||
| CVE-2026-48564 | No | No | - | - | Critical | 8.8 | 7.7 |
| CVE-2026-50370 | No | No | - | - | Critical | 8.8 | 7.7 |
| CVE-2026-56159 | No | No | - | - | Critical | 9.8 | 8.5 |
| DNS Client Tampering Vulnerability | |||||||
| CVE-2026-49174 | No | No | - | - | Important | 6.1 | 5.3 |
| CVE-2026-50495 | No | No | - | - | Important | 6.1 | 5.3 |
| Desktop Window Manager Elevation of Privilege Vulnerability | |||||||
| CVE-2026-50692 | No | No | - | - | Important | 8.8 | 7.7 |
| CVE-2026-58633 | No | No | - | - | Important | 7.8 | 6.8 |
| CVE-2026-58634 | No | No | - | - | Important | 7.8 | 6.8 |
| DirectX Graphics Kernel Elevation of Privilege Vulnerability | |||||||
| CVE-2026-50296 | No | No | - | - | Important | 7.0 | 6.1 |
| CVE-2026-50375 | No | No | - | - | Important | 6.3 | 5.5 |
| CVE-2026-50353 | No | No | - | - | Important | 7.8 | 6.8 |
| CVE-2026-50493 | No | No | - | - | Important | 7.8 | 6.8 |
| CVE-2026-56643 | No | No | - | - | Important | 7.8 | 6.8 |
| CVE-2026-56644 | No | No | - | - | Important | 7.8 | 6.8 |
| CVE-2026-58629 | No | No | - | - | Important | 7.0 | 6.1 |
| DirectX Graphics Kernel Remote Code Execution Vulnerability | |||||||
| CVE-2026-50382 | No | No | - | - | Critical | 8.8 | 7.7 |
| Extensible Storage Engine (ESENT) Elevation of Privilege Vulnerability | |||||||
| CVE-2026-57088 | No | No | - | - | Important | 7.8 | 6.8 |
| Game: Age of Empires II: Definitive Edition Remote Code Execution Vulnerability | |||||||
| CVE-2026-50663 | No | No | - | - | Important | 8.8 | 7.7 |
| GitHub Copilot Remote Code Execution Vulnerability | |||||||
| CVE-2026-50510 | No | No | - | - | Important | 7.8 | 6.8 |
| GitHub Copilot and Visual Studio Code Information Disclosure Vulnerability | |||||||
| CVE-2026-47282 | No | No | - | - | Important | 6.5 | 5.7 |
| GitHub Copilot and Visual Studio Code Security Feature Bypass Vulnerability | |||||||
| CVE-2026-41109 | No | No | - | - | Important | 8.8 | 7.7 |
| HTTP.sys Denial of Service Vulnerability | |||||||
| CVE-2026-49787 | No | No | - | - | Important | 7.5 | 6.5 |
| HTTP.sys Information Disclosure Vulnerability | |||||||
| CVE-2026-50420 | No | No | - | - | Important | 6.2 | 5.4 |
| HTTP/2 Denial of Service Vulnerability | |||||||
| CVE-2026-49788 | No | No | - | - | Important | 7.5 | 6.5 |
| Internet Key Exchange (IKE) Protocol Denial of Service Vulnerability | |||||||
| CVE-2026-50696 | No | No | - | - | Important | 7.5 | 6.5 |
| M365 Copilot for iOS Elevation of Privilege Vulnerability | |||||||
| CVE-2026-58617 | No | No | - | - | Important | 8.1 | 7.1 |
| Microsoft 365 Copilot Elevation of Privilege Vulnerability (no customer action required) |
|||||||
| CVE-2026-41106 | No | No | - | - | Critical | 9.3 | 8.1 |
| Microsoft Azure Synapse Elevation of Privilege Vulnerability (no customer action required) |
|||||||
| CVE-2026-26145 | No | No | - | - | Critical | 4.8 | 4.3 |
| Microsoft Bing App for IOS Spoofing Vulnerability | |||||||
| CVE-2026-58595 | No | No | - | - | Important | 8.1 | 7.1 |
| Microsoft Brokering File System Elevation of Privilege Vulnerability | |||||||
| CVE-2026-49162 | No | No | - | - | Important | 7.0 | 6.1 |
| CVE-2026-50305 | No | No | - | - | Important | 7.8 | 6.8 |
| CVE-2026-50361 | No | No | - | - | Important | 7.8 | 6.8 |
| CVE-2026-50466 | No | No | - | - | Important | 7.8 | 6.8 |
| CVE-2026-50458 | No | No | - | - | Important | 7.8 | 6.8 |
| Microsoft Copilot Remote Code Execution Vulnerability | |||||||
| CVE-2026-48561 | No | No | - | - | Critical | 9.6 | 8.3 |
| Microsoft DWM Core Library Elevation of Privilege Vulnerability | |||||||
| CVE-2026-50329 | No | No | - | - | Important | 7.8 | 6.8 |
| CVE-2026-58541 | No | No | - | - | Important | 7.8 | 6.8 |
| Microsoft Defender Remote Code Execution Vulnerability | |||||||
| CVE-2026-55011 | No | No | - | - | Critical | 7.8 | 6.8 |
| CVE-2026-55012 | No | No | - | - | Critical | 7.8 | 6.8 |
| Microsoft Defender for Endpoint for Mac Elevation of Privilege Vulnerability | |||||||
| CVE-2026-50658 | No | No | - | - | Important | 7.0 | 6.1 |
| CVE-2026-56178 | No | No | - | - | Important | 5.5 | 4.8 |
| Microsoft Defender for Endpoint for Mac Information Disclosure Vulnerability | |||||||
| CVE-2026-50657 | No | No | - | - | Important | 4.7 | 4.1 |
| Microsoft Dynamics NAV and Microsoft Dynamics 365 Business Central (On Premises) Remote Code Execution Vulnerability | |||||||
| CVE-2026-55944 | No | No | - | - | Critical | 9.8 | 8.5 |
| Microsoft Edge (Chromium-based) Elevation of Privilege Vulnerability | |||||||
| CVE-2026-58596 | No | No | - | - | Important | 8.3 | 7.2 |
| Microsoft Edge (Chromium-based) Information Disclosure Vulnerability | |||||||
| CVE-2026-55945 | No | No | - | - | Moderate | 4.2 | 3.7 |
| CVE-2026-57991 | No | No | - | - | Important | 7.4 | 6.4 |
| CVE-2026-58291 | No | No | - | - | Important | 6.1 | 5.3 |
| Microsoft Edge (Chromium-based) Remote Code Execution Vulnerability | |||||||
| CVE-2026-57981 | No | No | - | - | Important | 8.8 | 7.7 |
| CVE-2026-57984 | No | No | - | - | Important | 7.5 | 6.5 |
| CVE-2026-57985 | No | No | - | - | Important | 7.6 | 6.6 |
| CVE-2026-57986 | No | No | - | - | Important | 7.5 | 6.5 |
| CVE-2026-57988 | No | No | - | - | Important | 7.1 | 6.2 |
| CVE-2026-57992 | No | No | - | - | Important | 7.5 | 6.5 |
| CVE-2026-58276 | No | No | - | - | Important | 7.5 | 6.5 |
| CVE-2026-56645 | No | No | - | - | Important | 8.8 | 7.7 |
| CVE-2026-57974 | No | No | - | - | Important | 8.8 | 7.7 |
| CVE-2026-57975 | No | No | - | - | Important | 7.5 | 6.5 |
| CVE-2026-58281 | No | No | - | - | Important | 8.3 | 7.2 |
| CVE-2026-58284 | No | No | - | - | Important | 8.3 | 7.2 |
| CVE-2026-58285 | No | No | - | - | Important | 8.3 | 7.2 |
| CVE-2026-58287 | No | No | - | - | Important | 8.3 | 7.2 |
| CVE-2026-58288 | No | No | - | - | Important | 8.3 | 7.2 |
| CVE-2026-58289 | No | No | - | - | Important | 9.0 | 7.8 |
| CVE-2026-58290 | No | No | - | - | Important | 7.5 | 6.5 |
| CVE-2026-58292 | No | No | - | - | Important | 7.5 | 6.5 |
| CVE-2026-58293 | No | No | - | - | Important | 8.1 | 7.1 |
| CVE-2026-58294 | No | No | - | - | Important | 7.5 | 6.5 |
| Microsoft Edge (Chromium-based) Security Feature Bypass Vulnerability | |||||||
| CVE-2026-57983 | No | No | - | - | Important | 8.7 | 7.6 |
| CVE-2026-58295 | No | No | - | - | Important | 8.3 | 7.2 |
| CVE-2026-58525 | No | No | - | - | Important | 8.2 | 7.1 |
| Microsoft Edge (Chromium-based) Spoofing Vulnerability | |||||||
| CVE-2026-45488 | No | No | - | - | Moderate | 5.4 | 4.7 |
| CVE-2026-45489 | No | No | - | - | Moderate | 6.5 | 5.7 |
| CVE-2026-57987 | No | No | - | - | Important | 6.5 | 5.7 |
| CVE-2026-58278 | No | No | - | - | Important | 5.4 | 4.7 |
| CVE-2026-56646 | No | No | - | - | Important | 6.5 | 5.7 |
| CVE-2026-57977 | No | No | - | - | Important | 7.1 | 6.2 |
| CVE-2026-57993 | No | No | - | - | Important | 7.4 | 6.4 |
| CVE-2026-58282 | No | No | - | - | Important | 8.1 | 7.1 |
| CVE-2026-58283 | No | No | - | - | Important | 8.1 | 7.1 |
| CVE-2026-58286 | No | No | - | - | Important | 8.1 | 7.1 |
| CVE-2026-58298 | No | No | - | - | Important | 7.2 | 6.3 |
| CVE-2026-58524 | No | No | - | - | Important | 5.4 | 4.7 |
| CVE-2026-58597 | No | No | - | - | Low | 4.3 | 3.8 |
| Microsoft Edge for Android Information Disclosure Vulnerability | |||||||
| CVE-2026-58296 | No | No | - | - | Important | 7.1 | 6.2 |
| CVE-2026-58297 | No | No | - | - | Important | 7.1 | 6.2 |
| CVE-2026-58300 | No | No | - | - | Important | 6.2 | 5.4 |
| CVE-2026-58522 | No | No | - | - | Important | 6.8 | 5.9 |
| Microsoft Edge for Android Remote Code Execution Vulnerability | |||||||
| CVE-2026-58299 | No | No | - | - | Important | 7.5 | 6.5 |
| Microsoft Edge for Android Security Feature Bypass Vulnerability | |||||||
| CVE-2026-58523 | No | No | - | - | Important | 6.5 | 5.7 |
| Microsoft Entra Provisioning Service Elevation of Privilege Vulnerability (no customer action required) |
|||||||
| CVE-2026-57100 | No | No | - | - | Critical | 9.9 | 8.6 |
| Microsoft Excel Information Disclosure Vulnerability | |||||||
| CVE-2026-50678 | No | No | - | - | Important | 6.6 | 5.8 |
| CVE-2026-54988 | No | No | - | - | Important | 6.1 | 5.3 |
| CVE-2026-48580 | No | No | - | - | Important | 5.5 | 4.8 |
| CVE-2026-50408 | No | No | - | - | Important | 5.5 | 4.8 |
| CVE-2026-55046 | No | No | - | - | Important | 5.5 | 4.8 |
| CVE-2026-55138 | No | No | - | - | Important | 5.5 | 4.8 |
| CVE-2026-55054 | No | No | - | - | Important | 6.5 | 5.7 |
| CVE-2026-55122 | No | No | - | - | Important | 7.1 | 6.2 |
| CVE-2026-55898 | No | No | - | - | Important | 6.1 | 5.3 |
| Microsoft Excel Remote Code Execution Vulnerability | |||||||
| CVE-2026-50675 | No | No | - | - | Important | 7.8 | 6.8 |
| CVE-2026-55899 | No | No | - | - | Important | 7.8 | 6.8 |
| CVE-2026-55948 | No | No | - | - | Important | 7.8 | 6.8 |
| CVE-2026-58618 | No | No | - | - | Important | 7.8 | 6.8 |
| CVE-2026-47642 | No | No | - | - | Important | 7.8 | 6.8 |
| CVE-2026-55024 | No | No | - | - | Important | 7.8 | 6.8 |
| CVE-2026-55025 | No | No | - | - | Important | 7.8 | 6.8 |
| CVE-2026-55031 | No | No | - | - | Important | 7.8 | 6.8 |
| CVE-2026-55048 | No | No | - | - | Important | 7.8 | 6.8 |
| CVE-2026-55029 | No | No | - | - | Important | 7.8 | 6.8 |
| CVE-2026-55039 | No | No | - | - | Important | 7.8 | 6.8 |
| CVE-2026-55041 | No | No | - | - | Important | 7.8 | 6.8 |
| CVE-2026-55136 | No | No | - | - | Important | 7.8 | 6.8 |
| CVE-2026-55141 | No | No | - | - | Important | 7.8 | 6.8 |
| CVE-2026-55036 | No | No | - | - | Important | 7.8 | 6.8 |
| CVE-2026-55044 | No | No | - | - | Important | 7.8 | 6.8 |
| CVE-2026-55037 | No | No | - | - | Important | 7.8 | 6.8 |
| CVE-2026-55058 | No | No | - | - | Important | 7.8 | 6.8 |
| CVE-2026-55137 | No | No | - | - | Important | 7.8 | 6.8 |
| CVE-2026-55053 | No | No | - | - | Important | 7.8 | 6.8 |
| CVE-2026-55131 | No | No | - | - | Important | 7.8 | 6.8 |
| CVE-2026-54131 | No | No | - | - | Important | 7.8 | 6.8 |
| CVE-2026-55947 | No | No | - | - | Important | 7.8 | 6.8 |
| CVE-2026-55949 | No | No | - | - | Important | 7.8 | 6.8 |
| CVE-2026-56156 | No | No | - | - | Important | 7.8 | 6.8 |
| Microsoft Exchange Online Elevation of Privilege Vulnerability (no customer action required) |
|||||||
| CVE-2026-54998 | No | No | - | - | Critical | 8.8 | 7.7 |
| Microsoft Exchange Server Elevation of Privilege Vulnerability | |||||||
| CVE-2026-55006 | No | No | - | - | Important | 7.8 | 6.8 |
| CVE-2026-55009 | No | No | - | - | Important | 7.8 | 6.8 |
| Microsoft Exchange Server Remote Code Execution Vulnerability | |||||||
| CVE-2026-55005 | No | No | - | - | Important | 8.8 | 7.7 |
| Microsoft Exchange Server Spoofing Vulnerability | |||||||
| CVE-2026-55008 | No | No | - | - | Critical | 9.6 | 8.3 |
| Microsoft Fabric Data Warehouse Remote Code Execution Vulnerability | |||||||
| CVE-2026-56642 | No | No | - | - | Important | 8.8 | 7.7 |
| Microsoft Install Service Elevation of Privilege Vulnerability | |||||||
| CVE-2026-50343 | No | No | - | - | Important | 7.8 | 6.8 |
| Microsoft Message Queuing Queue Manager Remote Code Execution Vulnerability | |||||||
| CVE-2026-54992 | No | No | - | - | Critical | 8.4 | 7.3 |
| CVE-2026-50439 | No | No | - | - | Important | 8.1 | 7.1 |
| Microsoft NAT Helper Components (ipnathlp.dll) Elevation of Privilege Vulnerability | |||||||
| CVE-2026-58537 | No | No | - | - | Important | 7.8 | 6.8 |
| Microsoft Office Information Disclosure Vulnerability | |||||||
| CVE-2026-56193 | No | No | - | - | Important | 7.1 | 6.2 |
| CVE-2026-55023 | No | No | - | - | Important | 5.5 | 4.8 |
| CVE-2026-55026 | No | No | - | - | Important | 6.2 | 5.4 |
| CVE-2026-55027 | No | No | - | - | Important | 5.5 | 4.8 |
| CVE-2026-55028 | No | No | - | - | Important | 5.5 | 4.8 |
| CVE-2026-55047 | No | No | - | - | Important | 5.5 | 4.8 |
| CVE-2026-55035 | No | No | - | - | Important | 5.5 | 4.8 |
| CVE-2026-55057 | No | No | - | - | Important | 5.5 | 4.8 |
| CVE-2026-55042 | No | No | - | - | Important | 5.5 | 4.8 |
| CVE-2026-55139 | No | No | - | - | Important | 5.5 | 4.8 |
| CVE-2026-50665 | No | No | - | - | Important | 7.8 | 6.8 |
| CVE-2026-56192 | No | No | - | - | Important | 5.5 | 4.8 |
| CVE-2026-56195 | No | No | - | - | Important | 5.5 | 4.8 |
| CVE-2026-55121 | No | No | - | - | Important | 5.5 | 4.8 |
| Microsoft Office Remote Code Execution Vulnerability | |||||||
| CVE-2026-47290 | No | No | - | - | Important | 7.8 | 6.8 |
| CVE-2026-50301 | No | No | - | - | Important | 7.8 | 6.8 |
| CVE-2026-50314 | No | No | - | - | Critical | 7.8 | 6.8 |
| CVE-2026-50467 | No | No | - | - | Critical | 7.8 | 6.8 |
| CVE-2026-55017 | No | No | - | - | Important | 7.8 | 6.8 |
| CVE-2026-55018 | No | No | - | - | Critical | 7.8 | 6.8 |
| CVE-2026-55022 | No | No | - | - | Critical | 7.8 | 6.8 |
| CVE-2026-55125 | No | No | - | - | Important | 7.8 | 6.8 |
| CVE-2026-55045 | No | No | - | - | Critical | 8.4 | 7.3 |
| CVE-2026-55049 | No | No | - | - | Critical | 7.8 | 6.8 |
| CVE-2026-55129 | No | No | - | - | Critical | 7.8 | 6.8 |
| CVE-2026-55056 | No | No | - | - | Critical | 7.8 | 6.8 |
| CVE-2026-55140 | No | No | - | - | Critical | 7.8 | 6.8 |
| Microsoft OneNote Remote Code Execution Vulnerability | |||||||
| CVE-2026-55133 | No | No | - | - | Important | 7.8 | 6.8 |
| Microsoft PC Manager Elevation of Privilege Vulnerability | |||||||
| CVE-2026-58636 | No | No | - | - | Important | 7.8 | 6.8 |
| CVE-2026-50438 | No | No | - | - | Important | 8.8 | 7.7 |
| Microsoft PowerBI Report Server Spoofing Vulnerability | |||||||
| CVE-2026-58647 | No | No | - | - | Important | 8.0 | 7.0 |
| Microsoft PowerPoint Remote Code Execution Vulnerability | |||||||
| CVE-2026-55043 | No | No | - | - | Critical | 7.8 | 6.8 |
| CVE-2026-55123 | No | No | - | - | Critical | 7.8 | 6.8 |
| CVE-2026-55120 | No | No | - | - | Critical | 7.8 | 6.8 |
| Microsoft SQL Server Elevation of Privilege Vulnerability | |||||||
| CVE-2026-47296 | No | No | - | - | Important | 7.8 | 6.8 |
| CVE-2026-55002 | No | No | - | - | Important | 7.8 | 6.8 |
| CVE-2026-47295 | No | No | - | - | Important | 8.8 | 7.7 |
| Microsoft SQL Server Information Disclosure Vulnerability | |||||||
| CVE-2026-50468 | No | No | - | - | Important | 6.5 | 5.7 |
| CVE-2026-54116 | No | No | - | - | Important | 6.5 | 5.7 |
| Microsoft SQL Server Remote Code Execution Vulnerability | |||||||
| CVE-2026-54117 | No | No | - | - | Critical | 8.8 | 7.7 |
| CVE-2026-54118 | No | No | - | - | Critical | 8.8 | 7.7 |
| Microsoft SharePoint Elevation of Privilege Vulnerability | |||||||
| CVE-2026-55052 | No | No | - | - | Important | 8.8 | 7.7 |
| CVE-2026-58277 | No | No | - | - | Important | 8.8 | 7.7 |
| Microsoft SharePoint Remote Code Execution Vulnerability | |||||||
| CVE-2026-50522 | No | No | - | - | Critical | 9.8 | 8.5 |
| CVE-2026-58644 | No | No | - | - | Critical | 9.8 | 8.5 |
| Microsoft SharePoint Server Elevation of Privilege Vulnerability | |||||||
| CVE-2026-56164 | No | Yes | - | - | Moderate | 5.3 | 4.9 |
| Microsoft SharePoint Server Information Disclosure Vulnerability | |||||||
| CVE-2026-55051 | No | No | - | - | Important | 6.5 | 5.7 |
| Microsoft SharePoint Server Security Feature Bypass Vulnerability | |||||||
| CVE-2026-55040 | No | No | - | - | Critical | 9.1 | 7.9 |
| Microsoft SharePoint Server Spoofing Vulnerability | |||||||
| CVE-2026-54108 | No | No | - | - | Important | 6.5 | 5.7 |
| CVE-2026-55016 | No | No | - | - | Important | 4.6 | 4.0 |
| CVE-2026-55019 | No | No | - | - | Important | 4.6 | 4.0 |
| CVE-2026-55020 | No | No | - | - | Important | 4.6 | 4.0 |
| CVE-2026-55021 | No | No | - | - | Important | 7.3 | 6.4 |
| CVE-2026-55030 | No | No | - | - | Important | 4.6 | 4.0 |
| CVE-2026-55034 | No | No | - | - | Important | 7.3 | 6.4 |
| CVE-2026-55126 | No | No | - | - | Important | 7.3 | 6.4 |
| CVE-2026-55135 | No | No | - | - | Important | 4.6 | 4.0 |
| CVE-2026-56157 | No | No | - | - | Important | 5.4 | 4.7 |
| Microsoft Windows App Store Elevation of Privilege Vulnerability | |||||||
| CVE-2026-42900 | No | No | - | - | Important | 8.1 | 7.1 |
| CVE-2026-49784 | No | No | - | - | Important | 7.0 | 6.1 |
| CVE-2026-50356 | No | No | - | - | Important | 7.0 | 6.1 |
| Microsoft Windows App Store Information Disclosure Vulnerability | |||||||
| CVE-2026-49165 | No | No | - | - | Important | 7.1 | 6.2 |
| Microsoft Windows Media Foundation Remote Code Execution Vulnerability | |||||||
| CVE-2026-54993 | No | No | - | - | Important | 7.8 | 6.8 |
| CVE-2026-58610 | No | No | - | - | Important | 7.8 | 6.8 |
| CVE-2026-50655 | No | No | - | - | Critical | 7.8 | 6.8 |
| CVE-2026-56189 | No | No | - | - | Critical | 7.8 | 6.8 |
| CVE-2026-57090 | No | No | - | - | Critical | 8.8 | 7.7 |
| CVE-2026-57094 | No | No | - | - | Critical | 8.8 | 7.7 |
| CVE-2026-57087 | No | No | - | - | Critical | 8.8 | 7.7 |
| Microsoft Windows VMSwitch Elevation of Privilege Vulnerability | |||||||
| CVE-2026-57092 | No | No | - | - | Critical | 9.9 | 8.6 |
| Microsoft Word Information Disclosure Vulnerability | |||||||
| CVE-2026-55050 | No | No | - | - | Important | 5.5 | 4.8 |
| CVE-2026-55124 | No | No | - | - | Important | 5.5 | 4.8 |
| CVE-2026-55142 | No | No | - | - | Important | 5.5 | 4.8 |
| Microsoft Word Remote Code Execution Vulnerability | |||||||
| CVE-2026-55032 | No | No | - | - | Important | 7.8 | 6.8 |
| CVE-2026-55033 | No | No | - | - | Critical | 7.8 | 6.8 |
| CVE-2026-55127 | No | No | - | - | Critical | 7.8 | 6.8 |
| CVE-2026-55055 | No | No | - | - | Important | 7.8 | 6.8 |
| CVE-2026-55038 | No | No | - | - | Important | 7.8 | 6.8 |
| CVE-2026-55132 | No | No | - | - | Critical | 7.8 | 6.8 |
| CVE-2026-55134 | No | No | - | - | Important | 7.8 | 6.8 |
| CVE-2026-55128 | No | No | - | - | Important | 7.8 | 6.8 |
| CVE-2026-55130 | No | No | - | - | Important | 7.8 | 6.8 |
| Microsoft XML Core Services Elevation of Privilege Vulnerability | |||||||
| CVE-2026-50359 | No | No | - | - | Important | 7.0 | 6.1 |
| Microsoft XML Security Feature Bypass Vulnerability | |||||||
| CVE-2026-57097 | No | No | - | - | Important | 6.4 | 5.6 |
| Minecraft Bedrock Dedicated Server Remote Code Execution Vulnerability (no customer action required) |
|||||||
| CVE-2026-55010 | No | No | - | - | Critical | 9.8 | 8.5 |
| NTFS Elevation of Privilege Vulnerability | |||||||
| CVE-2026-50402 | No | No | - | - | Important | 7.8 | 6.8 |
| Netlogon RPC Elevation of Privilege Vulnerability | |||||||
| CVE-2026-50346 | No | No | - | - | Important | 7.8 | 6.8 |
| OData for ASP.NET and ASP.NET Core Denial of Service Vulnerability | |||||||
| CVE-2026-50506 | No | No | - | - | Important | 7.5 | 6.5 |
| CVE-2026-45646 | No | No | - | - | Important | 7.5 | 6.5 |
| Outlook Copilot Tampering Vulnerability | |||||||
| CVE-2026-55145 | No | No | - | - | Moderate | 6.3 | 5.7 |
| Quality Windows Audio/Video Experience (QWAVE) Elevation of Privilege Vulnerability | |||||||
| CVE-2026-54989 | No | No | - | - | Important | 7.0 | 6.1 |
| Remote Access Management service/API (RPC server) Elevation of Privilege Vulnerability | |||||||
| CVE-2026-50365 | No | No | - | - | Important | 8.0 | 7.0 |
| Remote Desktop Client Remote Code Execution Vulnerability | |||||||
| CVE-2026-54990 | No | No | - | - | Important | 9.8 | 8.5 |
| CVE-2026-50474 | No | No | - | - | Critical | 8.8 | 7.7 |
| CVE-2026-58594 | No | No | - | - | Important | 8.8 | 7.7 |
| Remote Desktop Protocol Remote Code Execution Vulnerability | |||||||
| CVE-2026-56190 | No | No | - | - | Important | 9.8 | 8.5 |
| SQL Server ODBC driver Elevation of Privilege Vulnerability | |||||||
| CVE-2026-42990 | No | No | - | - | Important | 9.8 | 8.5 |
| Secure Boot Security Feature Bypass Vulnerability | |||||||
| CVE-2026-49783 | No | No | - | - | Important | 7.8 | 6.8 |
| Storage Spaces Direct Elevation of Privilege Vulnerability | |||||||
| CVE-2026-49168 | No | No | - | - | Important | 6.8 | 5.9 |
| Surface Broker SDMA Elevation of Privilege Vulnerability | |||||||
| CVE-2026-48581 | No | No | - | - | Important | 7.8 | 6.8 |
| Universal Plug and Play (upnp.dll) Information Disclosure Vulnerability | |||||||
| CVE-2026-49180 | No | No | - | - | Important | 5.5 | 4.8 |
| CVE-2026-50455 | No | No | - | - | Important | 5.5 | 4.8 |
| Universal Print Management Service Elevation of Privilege Vulnerability | |||||||
| CVE-2026-54111 | No | No | - | - | Important | 7.0 | 6.1 |
| CVE-2026-58543 | No | No | - | - | Important | 6.3 | 5.5 |
| Virtual Hard Disk (VHD) Miniport Driver Elevation of Privilege Vulernability | |||||||
| CVE-2026-58601 | No | No | - | - | Important | 7.8 | 6.8 |
| Visual Studio Code Remote Code Execution Vulnerability | |||||||
| CVE-2026-50520 | No | No | - | - | Important | 8.4 | 7.3 |
| Visual Studio Code Security Feature Bypass Vulnerability | |||||||
| CVE-2026-45496 | No | No | - | - | Important | 5.5 | 4.8 |
| CVE-2026-57101 | No | No | - | - | Important | 7.1 | 6.2 |
| CVE-2026-57102 | No | No | - | - | Important | 8.8 | 7.7 |
| Visual Studio Remote Code Execution Vulnerability | |||||||
| CVE-2026-47305 | No | No | - | - | Important | 7.8 | 6.8 |
| Win32k Elevation of Privilege Vulnerability | |||||||
| CVE-2026-49805 | No | No | - | - | Important | 7.0 | 6.1 |
| CVE-2026-50297 | No | No | - | - | Important | 7.0 | 6.1 |
| CVE-2026-50325 | No | No | - | - | Important | 7.0 | 6.1 |
| CVE-2026-50489 | No | No | - | - | Important | 8.8 | 7.7 |
| CVE-2026-57095 | No | No | - | - | Important | 6.2 | 5.4 |
| Win32k Information Disclosure Vulnerability | |||||||
| CVE-2026-50416 | No | No | - | - | Important | 3.3 | 2.9 |
| CVE-2026-56184 | No | No | - | - | Important | 5.5 | 4.8 |
| Window Virtual Filtering Platform (VFP) Denial of Service Vulnerability | |||||||
| CVE-2026-50432 | No | No | - | - | Important | 5.3 | 4.6 |
| Windows Active Directory Denial of Service Vulnerability | |||||||
| CVE-2026-54119 | No | No | - | - | Important | 7.5 | 6.5 |
| Windows Active Directory Domain Services Denial of Service Vulnerability | |||||||
| CVE-2026-57976 | No | No | - | - | Important | 6.5 | 5.7 |
| CVE-2026-50366 | No | No | - | - | Important | 6.5 | 5.7 |
| Windows Active Directory Domain Services Remote Code Execution Vulnerability | |||||||
| CVE-2026-49164 | No | No | - | - | Critical | 8.1 | 7.1 |
| CVE-2026-49178 | No | No | - | - | Important | 8.8 | 7.7 |
| Windows Active Directory Federation Services (ADFS) Information Disclosure Vulnerability | |||||||
| CVE-2026-58529 | No | No | - | - | Important | 7.1 | 6.2 |
| Windows Active Directory Federation Services Denial of Service Vulnerability | |||||||
| CVE-2026-54983 | No | No | - | - | Important | 7.5 | 6.5 |
| CVE-2026-50695 | No | No | - | - | Important | 7.5 | 6.5 |
| CVE-2026-50304 | No | No | - | - | Important | 7.5 | 6.5 |
| CVE-2026-50368 | No | No | - | - | Important | 7.5 | 6.5 |
| CVE-2026-50324 | No | No | - | - | Important | 5.9 | 5.2 |
| CVE-2026-50355 | No | No | - | - | Important | 7.5 | 6.5 |
| CVE-2026-50411 | No | No | - | - | Important | 7.5 | 6.5 |
| Windows Admin Center (WAC) Remote Code Execution Vulnerability | |||||||
| CVE-2026-58631 | No | No | - | - | Important | 7.8 | 6.8 |
| CVE-2026-56196 | No | No | - | - | Important | 8.8 | 7.7 |
| CVE-2026-56197 | No | No | - | - | Important | 8.8 | 7.7 |
| Windows Admin Center Elevation of Privilege Vulnerability | |||||||
| CVE-2026-56169 | No | No | - | - | Important | 8.1 | 7.1 |
| CVE-2026-57107 | No | No | - | - | Important | 7.8 | 6.8 |
| Windows Admin Center Information Disclosure Vulnerability | |||||||
| CVE-2026-56185 | No | No | - | - | Important | 6.5 | 5.7 |
| Windows Ancillary Function Driver for WinSock Elevation of Privilege Vulnerability | |||||||
| CVE-2026-50312 | No | No | - | - | Important | 4.7 | 4.1 |
| CVE-2026-50462 | No | No | - | - | Important | 7.8 | 6.8 |
| CVE-2026-57093 | No | No | - | - | Important | 7.0 | 6.1 |
| Windows Ancillary Function Driver for WinSock Information Disclosure Vulnerability | |||||||
| CVE-2026-34346 | No | No | - | - | Important | 5.5 | 4.8 |
| Windows App Package Installer Elevation of Privilege Vulnerability | |||||||
| CVE-2026-48572 | No | No | - | - | Important | 7.0 | 6.1 |
| CVE-2026-48571 | No | No | - | - | Important | 7.0 | 6.1 |
| CVE-2026-50400 | No | No | - | - | Important | 7.8 | 6.8 |
| Windows AppX Deployment Extensions Elevation of Privilege Vulnerability | |||||||
| CVE-2026-49803 | No | No | - | - | Important | 7.0 | 6.1 |
| Windows Application Model Core API Elevation of Privilege Vulnerability | |||||||
| CVE-2026-50331 | No | No | - | - | Important | 7.8 | 6.8 |
| Windows Audio Compression Manager (ACM) Elevation of Privilege Vulnerability | |||||||
| CVE-2026-50351 | No | No | - | - | Important | 7.8 | 6.8 |
| Windows Audio Service Elevation of Privilege Vulnerability | |||||||
| CVE-2026-50440 | No | No | - | - | Important | 7.8 | 6.8 |
| Windows Audio Service Information Disclosure Vulnerability | |||||||
| CVE-2026-34328 | No | No | - | - | Important | 5.5 | 4.8 |
| Windows Backup Engine Elevation of Privilege Vulnerability | |||||||
| CVE-2026-50406 | No | No | - | - | Important | 7.0 | 6.1 |
| Windows Backup Service Elevation of Privilege Vulnerability | |||||||
| CVE-2026-50364 | No | No | - | - | Important | 7.3 | 6.4 |
| Windows BitLocker Security Feature Bypass Vulnerability | |||||||
| CVE-2026-50661 | Yes | No | - | - | Important | 6.1 | 5.3 |
| Windows Bluetooth Port Driver Remote Code Execution | |||||||
| CVE-2026-42975 | No | No | - | - | Important | 8.0 | 7.0 |
| Windows Bluetooth Service Elevation of Privilege Vulnerability | |||||||
| CVE-2026-58538 | No | No | - | - | Important | 7.8 | 6.8 |
| Windows Boot Loader Security Feature Bypass Vulnerability | |||||||
| CVE-2026-58638 | No | No | - | - | Important | 6.0 | 5.2 |
| Windows Client-Side Caching Elevation of Privilege Vulnerability | |||||||
| CVE-2026-58637 | No | No | - | - | Important | 7.0 | 6.1 |
| Windows Clip Service Elevation of Privilege Vulnerability | |||||||
| CVE-2026-50384 | No | No | - | - | Important | 7.0 | 6.1 |
| Windows Clipboard Server Elevation of Privilege Vulnerability | |||||||
| CVE-2026-49183 | No | No | - | - | Important | 7.0 | 6.1 |
| CVE-2026-50689 | No | No | - | - | Important | 7.8 | 6.8 |
| Windows Cloud Files Mini Filter Driver Elevation of Privilege Vulnerability | |||||||
| CVE-2026-50374 | No | No | - | - | Important | 6.3 | 5.5 |
| CVE-2026-58536 | No | No | - | - | Important | 7.8 | 6.8 |
| CVE-2026-58613 | No | No | - | - | Important | 7.8 | 6.8 |
| Windows Cloud Files Mini Filter Driver Information Disclosure Vulnerability | |||||||
| CVE-2026-50401 | No | No | - | - | Important | 5.5 | 4.8 |
| Windows Common Log File System Driver Elevation of Privilege Vulnerability | |||||||
| CVE-2026-50697 | No | No | - | - | Important | 7.8 | 6.8 |
| CVE-2026-50667 | No | No | - | - | Important | 7.8 | 6.8 |
| Windows Connected User Experiences and Telemetry Elevation of Privilege Vulnerability | |||||||
| CVE-2026-50421 | No | No | - | - | Important | 7.8 | 6.8 |
| Windows Container Isolation FS Filter Driver (unionfs.sys) Information Disclosure Vulnerability | |||||||
| CVE-2026-50428 | No | No | - | - | Important | 7.1 | 6.2 |
| Windows Cryptographic Services Information Disclosure Vulnerability | |||||||
| CVE-2026-50352 | No | No | - | - | Important | 5.5 | 4.8 |
| Windows Cryptographic Services Security Feature Bypass Vulnerability | |||||||
| CVE-2026-50302 | No | No | - | - | Important | 4.2 | 3.7 |
| Windows Cryptography API: Next Generation (CNG) Tampering Vulnerability | |||||||
| CVE-2026-55144 | No | No | - | - | Important | 7.1 | 6.2 |
| Windows DHCP Client Elevation of Privilege Vulnerability | |||||||
| CVE-2026-49181 | No | No | - | - | Important | 7.5 | 6.5 |
| CVE-2026-50683 | No | No | - | - | Important | 8.0 | 7.0 |
| Windows DHCP Client Remote Code Execution Vulnerability | |||||||
| CVE-2026-54128 | No | No | - | - | Critical | 8.4 | 7.3 |
| Windows DHCP Server Denial of Service Vulnerability | |||||||
| CVE-2026-58627 | No | No | - | - | Important | 7.5 | 6.5 |
| Windows DHCP Server Remote Code Execution Vulnerability | |||||||
| CVE-2026-50518 | No | No | - | - | Critical | 9.8 | 8.5 |
| CVE-2026-50685 | No | No | - | - | Important | 7.5 | 6.5 |
| Windows DNS Client Elevation of Privilege Vulnerability | |||||||
| CVE-2026-49175 | No | No | - | - | Important | 7.8 | 6.8 |
| CVE-2026-50487 | No | No | - | - | Important | 8.1 | 7.1 |
| Windows DNS Client Tampering Vulnerability | |||||||
| CVE-2026-50465 | No | No | - | - | Important | 7.1 | 6.2 |
| Windows DNS Server Remote Code Execution Vulnerability | |||||||
| CVE-2026-49169 | No | No | - | - | Important | 8.0 | 7.0 |
| CVE-2026-50426 | No | No | - | - | Important | 6.8 | 5.9 |
| Windows DWM Core Library Information Disclosure Vulnerability | |||||||
| CVE-2026-50300 | No | No | - | - | Important | 5.5 | 4.8 |
| CVE-2026-50437 | No | No | - | - | Important | 5.5 | 4.8 |
| Windows Data.dll Remote Code Execution Vulnerability | |||||||
| CVE-2026-50347 | No | No | - | - | Important | 7.8 | 6.8 |
| Windows DirectX Information Disclosure Vulnerability | |||||||
| CVE-2026-49807 | No | No | - | - | Important | 6.2 | 5.4 |
| Windows Domain Controller Denial of Service Vulnerability | |||||||
| CVE-2026-50424 | No | No | - | - | Important | 7.5 | 6.5 |
| Windows Event Logging Service Information Disclosure Vulnerability | |||||||
| CVE-2026-34348 | No | No | - | - | Important | 6.5 | 5.7 |
| Windows Event Logging Service Remote Code Execution Vulnerability | |||||||
| CVE-2026-50502 | No | No | - | - | Important | 8.0 | 7.0 |
| Windows FTP Service Remote Code Execution Vulnerability | |||||||
| CVE-2026-49172 | No | No | - | - | Important | 9.8 | 8.5 |
| Windows File Explorer Information Disclosure Vulnerability | |||||||
| CVE-2026-33842 | No | No | - | - | Important | 5.5 | 4.8 |
| CVE-2026-40422 | No | No | - | - | Important | 5.5 | 4.8 |
| CVE-2026-41087 | No | No | - | - | Important | 5.5 | 4.8 |
| CVE-2026-50473 | No | No | - | - | Important | 5.5 | 4.8 |
| CVE-2026-50442 | No | No | - | - | Important | 5.5 | 4.8 |
| CVE-2026-50389 | No | No | - | - | Important | 5.5 | 4.8 |
| CVE-2026-50456 | No | No | - | - | Important | 5.5 | 4.8 |
| CVE-2026-57084 | No | No | - | - | Important | 5.5 | 4.8 |
| Windows File History Service Elevation of Privilege Vulnerability | |||||||
| CVE-2026-57091 | No | No | - | - | Important | 7.8 | 6.8 |
| Windows Filtering Platform Elevation of Privilege Vulnerability | |||||||
| CVE-2026-50405 | No | No | - | - | Important | 7.8 | 6.8 |
| Windows GDI Elevation of Privilege Vulnerability | |||||||
| CVE-2026-50387 | No | No | - | - | Important | 7.8 | 6.8 |
| Windows GDI+ Remote Code Execution Vulnerability | |||||||
| CVE-2026-54122 | No | No | - | - | Important | 8.4 | 7.3 |
| CVE-2026-49796 | No | No | - | - | Critical | 7.8 | 6.8 |
| CVE-2026-50380 | No | No | - | - | Critical | 9.6 | 8.3 |
| Windows Graphics Component Information Disclosure Vulnerability | |||||||
| CVE-2026-50483 | No | No | - | - | Important | 5.5 | 4.8 |
| Windows Graphics Component Remote Code Execution Vulnerability | |||||||
| CVE-2026-58609 | No | No | - | - | Important | 7.8 | 6.8 |
| Windows Group Policy Elevation of Privilege Vulnerability | |||||||
| CVE-2026-50391 | No | No | - | - | Important | 7.8 | 6.8 |
| Windows Human Interface Device Information Disclosure Vulnerability | |||||||
| CVE-2026-50310 | No | No | - | - | Important | 4.7 | 4.1 |
| Windows Hyper-V Denial of Service Vulnerability | |||||||
| CVE-2026-50485 | No | No | - | - | Important | 4.5 | 3.9 |
| Windows Hyper-V Elevation of Privilege Vulnerability | |||||||
| CVE-2026-54129 | No | No | - | - | Important | 7.0 | 6.1 |
| CVE-2026-54127 | No | No | - | - | Critical | 7.4 | 6.4 |
| CVE-2026-50680 | No | No | - | - | Critical | 8.2 | 7.1 |
| Windows Image Acquisition Elevation of Privilege Vulnerability | |||||||
| CVE-2026-50315 | No | No | - | - | Important | 7.8 | 6.8 |
| Windows Input Method Editor (IME) Elevation of Privilege Vulnerability | |||||||
| CVE-2026-58534 | No | No | - | - | Important | 8.8 | 7.7 |
| Windows Installer Elevation of Privilege Vulnerability | |||||||
| CVE-2026-50490 | No | No | - | - | Important | 7.0 | 6.1 |
| CVE-2026-58540 | No | No | - | - | Important | 7.8 | 6.8 |
| Windows Internal System User Profile Elevation of Privilege Vulnerability | |||||||
| CVE-2026-50425 | No | No | - | - | Important | 7.8 | 6.8 |
| Windows Internal Task Bar Elevation of Privilege Vulnerability | |||||||
| CVE-2026-50293 | No | No | - | - | Important | 7.8 | 6.8 |
| Windows Kernel Elevation of Privilege Vulnerability | |||||||
| CVE-2026-49167 | No | No | - | - | Important | 4.7 | 4.1 |
| CVE-2026-49173 | No | No | - | - | Important | 7.8 | 6.8 |
| CVE-2026-54132 | No | No | - | - | Important | 6.8 | 5.9 |
| CVE-2026-49795 | No | No | - | - | Important | 8.8 | 7.7 |
| CVE-2026-49798 | No | No | - | - | Important | 9.3 | 8.1 |
| CVE-2026-49808 | No | No | - | - | Important | 7.8 | 6.8 |
| CVE-2026-50354 | No | No | - | - | Important | 7.1 | 6.2 |
| CVE-2026-50332 | No | No | - | - | Important | 7.8 | 6.8 |
| CVE-2026-50377 | No | No | - | - | Important | 5.5 | 4.8 |
| CVE-2026-50390 | No | No | - | - | Important | 7.0 | 6.1 |
| CVE-2026-50423 | No | No | - | - | Important | 7.8 | 6.8 |
| CVE-2026-50397 | No | No | - | - | Important | 7.0 | 6.1 |
| CVE-2026-50436 | No | No | - | - | Important | 7.8 | 6.8 |
| CVE-2026-50399 | No | No | - | - | Important | 7.8 | 6.8 |
| CVE-2026-50459 | No | No | - | - | Important | 7.0 | 6.1 |
| CVE-2026-50477 | No | No | - | - | Important | 8.8 | 7.7 |
| CVE-2026-50478 | No | No | - | - | Important | 7.8 | 6.8 |
| CVE-2026-50484 | No | No | - | - | Important | 7.8 | 6.8 |
| CVE-2026-50673 | No | No | - | - | Important | 7.8 | 6.8 |
| CVE-2026-58532 | No | No | - | - | Important | 7.8 | 6.8 |
| Windows Kernel Information Disclosure Vulnerability | |||||||
| CVE-2026-50294 | No | No | - | - | Important | 6.2 | 5.4 |
| CVE-2026-50316 | No | No | - | - | Important | 5.5 | 4.8 |
| CVE-2026-50419 | No | No | - | - | Important | 3.3 | 2.9 |
| CVE-2026-50463 | No | No | - | - | Important | 7.5 | 6.5 |
| CVE-2026-50475 | No | No | - | - | Important | 5.5 | 4.8 |
| CVE-2026-50429 | No | No | - | - | Important | 8.2 | 7.1 |
| Windows Kernel Security Feature Bypass Vulnerability | |||||||
| CVE-2026-58614 | No | No | - | - | Important | 5.5 | 4.8 |
| CVE-2026-58545 | No | No | - | - | Important | 5.5 | 4.8 |
| Windows Kernel-Mode Driver Elevation of Privilege Vulnerability | |||||||
| CVE-2026-58602 | No | No | - | - | Important | 7.8 | 6.8 |
| CVE-2026-50393 | No | No | - | - | Important | 7.0 | 6.1 |
| CVE-2026-50396 | No | No | - | - | Important | 7.0 | 6.1 |
| Windows Key Guard Elevation of Privilege Vulnerability | |||||||
| CVE-2026-50378 | No | No | - | - | Important | 7.8 | 6.8 |
| Windows Key Guard Security Feature Bypass Vulnerability | |||||||
| CVE-2026-50303 | No | No | - | - | Important | 5.5 | 4.8 |
| Windows LUA File Virtualization Filter Driver Elevation of Privilege Vulnerability | |||||||
| CVE-2026-50371 | No | No | - | - | Important | 7.0 | 6.1 |
| Windows Local Security Authority Subsystem Service (LSASS) Denial of Service Vulnerability | |||||||
| CVE-2026-40378 | No | No | - | - | Important | 7.5 | 6.5 |
| CVE-2026-49799 | No | No | - | - | Important | 6.5 | 5.7 |
| Windows MIDI Service Module Elevation of Privileges Vulnerability | |||||||
| CVE-2026-50342 | No | No | - | - | Important | 8.8 | 7.7 |
| CVE-2026-56183 | No | No | - | - | Important | 7.0 | 6.1 |
| CVE-2026-56187 | No | No | - | - | Important | 7.0 | 6.1 |
| Windows Management Services Elevation of Privilege Vulnerability | |||||||
| CVE-2026-58544 | No | No | - | - | Important | 7.0 | 6.1 |
| Windows Media Elevation of Privilege Vulnerability | |||||||
| CVE-2026-50404 | No | No | - | - | Important | 7.0 | 6.1 |
| CVE-2026-50358 | No | No | - | - | Important | 7.0 | 6.1 |
| CVE-2026-50336 | No | No | - | - | Important | 7.8 | 6.8 |
| CVE-2026-50398 | No | No | - | - | Important | 8.8 | 7.7 |
| CVE-2026-50414 | No | No | - | - | Important | 7.5 | 6.5 |
| CVE-2026-50379 | No | No | - | - | Important | 7.5 | 6.5 |
| CVE-2026-50433 | No | No | - | - | Important | 7.8 | 6.8 |
| CVE-2026-50676 | No | No | - | - | Important | 7.8 | 6.8 |
| CVE-2026-50677 | No | No | - | - | Important | 7.8 | 6.8 |
| Windows Media Information Disclosure Vulnerability | |||||||
| CVE-2026-34349 | No | No | - | - | Important | 5.5 | 4.8 |
| CVE-2026-50394 | No | No | - | - | Important | 5.5 | 4.8 |
| CVE-2026-50415 | No | No | - | - | Important | 5.3 | 4.6 |
| Windows Media Photo Codec Information Disclosure Vulnerability | |||||||
| CVE-2026-57083 | No | No | - | - | Important | 5.5 | 4.8 |
| Windows Media Remote Code Execution Vulnerability | |||||||
| CVE-2026-50327 | No | No | - | - | Critical | 7.8 | 6.8 |
| CVE-2026-58542 | No | No | - | - | Critical | 7.8 | 6.8 |
| Windows Message Queuing (MSMQ) Elevation of Privilege Vulnerability | |||||||
| CVE-2026-54115 | No | No | - | - | Important | 7.8 | 6.8 |
| Windows Message Queuing Service (MSMQ) Remote Code Execution Vulnerability | |||||||
| CVE-2026-50447 | No | No | - | - | Important | 9.8 | 8.5 |
| CVE-2026-50505 | No | No | - | - | Important | 7.5 | 6.5 |
| Windows NFS Server Elevation of Privilege Vulnerability | |||||||
| CVE-2026-56194 | No | No | - | - | Important | 8.8 | 7.7 |
| CVE-2026-56648 | No | No | - | - | Important | 7.5 | 6.5 |
| Windows NTFS Elevation of Privilege Vulnerability | |||||||
| CVE-2026-49789 | No | No | - | - | Important | 7.3 | 6.4 |
| CVE-2026-50412 | No | No | - | - | Important | 7.8 | 6.8 |
| CVE-2026-50422 | No | No | - | - | Important | 7.8 | 6.8 |
| CVE-2026-50672 | No | No | - | - | Important | 7.0 | 6.1 |
| CVE-2026-56175 | No | No | - | - | Important | 7.8 | 6.8 |
| CVE-2026-56182 | No | No | - | - | Important | 7.8 | 6.8 |
| Windows NTFS Information Disclosure Vulnerability | |||||||
| CVE-2026-50341 | No | No | - | - | Important | 5.5 | 4.8 |
| Windows NTFS Remote Code Execution Vulnerability | |||||||
| CVE-2026-58640 | No | No | - | - | Important | 7.3 | 6.4 |
| CVE-2026-49184 | No | No | - | - | Important | 8.4 | 7.3 |
| CVE-2026-49797 | No | No | - | - | Important | 7.8 | 6.8 |
| CVE-2026-50308 | No | No | - | - | Important | 7.8 | 6.8 |
| CVE-2026-50386 | No | No | - | - | Important | 7.8 | 6.8 |
| CVE-2026-50309 | No | No | - | - | Important | 7.8 | 6.8 |
| CVE-2026-50313 | No | No | - | - | Important | 7.8 | 6.8 |
| CVE-2026-50388 | No | No | - | - | Important | 7.8 | 6.8 |
| CVE-2026-50448 | No | No | - | - | Important | 7.8 | 6.8 |
| CVE-2026-50471 | No | No | - | - | Important | 7.8 | 6.8 |
| CVE-2026-50461 | No | No | - | - | Important | 7.8 | 6.8 |
| CVE-2026-50417 | No | No | - | - | Important | 7.8 | 6.8 |
| CVE-2026-50482 | No | No | - | - | Important | 7.3 | 6.4 |
| CVE-2026-50494 | No | No | - | - | Important | 7.8 | 6.8 |
| Windows Narrator Braille Elevation of Privilege Vulnerability | |||||||
| CVE-2026-58635 | No | No | - | - | Important | 7.8 | 6.8 |
| Windows Netlogon Elevation of Privilege Vulnerability | |||||||
| CVE-2026-50500 | No | No | - | - | Important | 7.5 | 6.5 |
| Windows Network Address Translation (NAT) Spoofing Vulnerability | |||||||
| CVE-2026-56181 | No | No | - | - | Moderate | 8.3 | 7.2 |
| Windows Network Connections Service Elevation of Privilege Vulnerability | |||||||
| CVE-2026-50476 | No | No | - | - | Important | 7.8 | 6.8 |
| CVE-2026-50450 | No | No | - | - | Important | 7.8 | 6.8 |
| Windows Network File System Elevation of Privilege Vulnerability | |||||||
| CVE-2026-56650 | No | No | - | - | Important | 7.8 | 6.8 |
| Windows Network File System Remote Code Execution Vulnerability | |||||||
| CVE-2026-56649 | No | No | - | - | Important | 5.9 | 5.2 |
| Windows Network Policy Server SNMP Information Disclosure Vulnerability | |||||||
| CVE-2026-50470 | No | No | - | - | Important | 7.5 | 6.5 |
| CVE-2026-50496 | No | No | - | - | Important | 7.5 | 6.5 |
| Windows Notification Elevation of Privilege Vulnerability | |||||||
| CVE-2026-50337 | No | No | - | - | Important | 7.8 | 6.8 |
| Windows OLE Elevation of Privilege Vulnerability | |||||||
| CVE-2026-50344 | No | No | - | - | Important | 7.8 | 6.8 |
| Windows OLE Remote Code Execution Vulnerability | |||||||
| CVE-2026-50686 | No | No | - | - | Important | 8.1 | 7.1 |
| Windows Operating Systems Elevation of Privilege Vulnerability | |||||||
| CVE-2026-50335 | No | No | - | - | Important | 7.8 | 6.8 |
| CVE-2026-50317 | No | No | - | - | Important | 7.8 | 6.8 |
| Windows Overlay Filter Elevation of Privilege Vulnerability | |||||||
| CVE-2026-54987 | No | No | - | - | Important | 7.8 | 6.8 |
| CVE-2026-50435 | No | No | - | - | Important | 7.8 | 6.8 |
| Windows Overlay Filter Information Disclosure Vulnerability | |||||||
| CVE-2026-50409 | No | No | - | - | Important | 5.5 | 4.8 |
| Windows PowerShell Remote Code Execution Vulnerability | |||||||
| CVE-2026-40400 | No | No | - | - | Important | 8.0 | 7.0 |
| Windows Print Configuration Elevation of Privilege Vulnerability | |||||||
| CVE-2026-49166 | No | No | - | - | Important | 7.8 | 6.8 |
| CVE-2026-55004 | No | No | - | - | Important | 7.8 | 6.8 |
| Windows Print Spooler Elevation of Privilege Vulnerability | |||||||
| CVE-2026-50499 | No | No | - | - | Important | 7.8 | 6.8 |
| Windows Print Spooler Information Disclosure Vulnerability | |||||||
| CVE-2026-50383 | No | No | - | - | Important | 6.1 | 5.3 |
| CVE-2026-57085 | No | No | - | - | Important | 5.5 | 4.8 |
| Windows Print Spooler Remote Code Execution Vulnerability | |||||||
| CVE-2026-58608 | No | No | - | - | Critical | 8.8 | 7.7 |
| Windows Projected File System Elevation of Privilege Vulnerability | |||||||
| CVE-2026-50469 | No | No | - | - | Important | 7.8 | 6.8 |
| Windows Push Notification Information Disclosure Vulnerability | |||||||
| CVE-2026-50434 | No | No | - | - | Important | 5.5 | 4.8 |
| CVE-2026-50339 | No | No | - | - | Important | 5.5 | 4.8 |
| CVE-2026-50430 | No | No | - | - | Important | 5.5 | 4.8 |
| CVE-2026-50334 | No | No | - | - | Important | 5.5 | 4.8 |
| Windows Push Notifications Elevation of Privilege Vulnerability | |||||||
| CVE-2026-44800 | No | No | - | - | Important | 7.8 | 6.8 |
| CVE-2026-50363 | No | No | - | - | Important | 7.8 | 6.8 |
| Windows Quality of Service (QoS) Packet Scheduler Information Disclosure Vulnerability | |||||||
| CVE-2026-50431 | No | No | - | - | Important | 5.5 | 4.8 |
| Windows Redirected Drive Buffering System Elevation of Privilege Vulnerability | |||||||
| CVE-2026-50372 | No | No | - | - | Important | 7.0 | 6.1 |
| Windows Reliable Multicast Transport Driver (RMCAST) Remote Code Execution Vulnerability | |||||||
| CVE-2026-54982 | No | No | - | - | Critical | 8.8 | 7.7 |
| CVE-2026-54995 | No | No | - | - | Critical | 8.1 | 7.1 |
| Windows Remote Access Elevation of Privilege Vulnerability | |||||||
| CVE-2026-50666 | No | No | - | - | Important | 8.8 | 7.7 |
| Windows Remote Access Service Infrastructure Elevation of Privilege Vulnerability | |||||||
| CVE-2026-56647 | No | No | - | - | Important | 8.8 | 7.7 |
| Windows Remote Desktop Client Elevation of Privilege Vulnerability | |||||||
| CVE-2026-50330 | No | No | - | - | Important | 7.5 | 6.5 |
| Windows Remote Desktop Client Information Disclosure Vulnerability | |||||||
| CVE-2026-50376 | No | No | - | - | Important | 6.5 | 5.7 |
| CVE-2026-50504 | No | No | - | - | Important | 6.5 | 5.7 |
| CVE-2026-58533 | No | No | - | - | Important | 6.5 | 5.7 |
| CVE-2026-58535 | No | No | - | - | Important | 6.5 | 5.7 |
| CVE-2026-58546 | No | No | - | - | Important | 6.5 | 5.7 |
| CVE-2026-58539 | No | No | - | - | Important | 6.5 | 5.7 |
| Windows Remote Desktop Protocol (RDP) Information Disclosure Vulnerability | |||||||
| CVE-2026-55003 | No | No | - | - | Important | 6.5 | 5.7 |
| CVE-2026-57979 | No | No | - | - | Important | 6.5 | 5.7 |
| CVE-2026-50445 | No | No | - | - | Important | 6.5 | 5.7 |
| CVE-2026-50497 | No | No | - | - | Important | 6.5 | 5.7 |
| CVE-2026-54126 | No | No | - | - | Important | 6.5 | 5.7 |
| CVE-2026-57982 | No | No | - | - | Important | 6.5 | 5.7 |
| Windows Remote Desktop Services Elevation of Privilege Vulnerability | |||||||
| CVE-2026-50369 | No | No | - | - | Important | 8.8 | 7.7 |
| Windows Remote Desktop Services Remote Code Execution Vulnerability | |||||||
| CVE-2026-58626 | No | No | - | - | Important | 8.8 | 7.7 |
| Windows Remote Help Defense Elevation of Privilege Vulnerability | |||||||
| CVE-2026-55014 | No | No | - | - | Important | 7.8 | 6.8 |
| Windows Resilient File System (ReFS) Elevation of Privilege Vulnerability | |||||||
| CVE-2026-50318 | No | No | - | - | Important | 7.8 | 6.8 |
| CVE-2026-50407 | No | No | - | - | Important | 7.8 | 6.8 |
| CVE-2026-50357 | No | No | - | - | Important | 7.8 | 6.8 |
| CVE-2026-50441 | No | No | - | - | Important | 7.8 | 6.8 |
| CVE-2026-50668 | No | No | - | - | Important | 6.8 | 5.9 |
| Windows Resilient File System (ReFS) Remote Code Execution Vulnerability | |||||||
| CVE-2026-54109 | No | No | - | - | Important | 7.8 | 6.8 |
| CVE-2026-49792 | No | No | - | - | Important | 7.8 | 6.8 |
| CVE-2026-49793 | No | No | - | - | Important | 7.8 | 6.8 |
| CVE-2026-50362 | No | No | - | - | Important | 7.8 | 6.8 |
| CVE-2026-50492 | No | No | - | - | Important | 6.8 | 5.9 |
| CVE-2026-50501 | No | No | - | - | Important | 7.8 | 6.8 |
| CVE-2026-58530 | No | No | - | - | Important | 7.8 | 6.8 |
| Windows Routing and Remote Access Service (RRAS) Elevation of Privilege Vulnerability | |||||||
| CVE-2026-49791 | No | No | - | - | Important | 7.1 | 6.2 |
| CVE-2026-50451 | No | No | - | - | Important | 7.1 | 6.2 |
| CVE-2026-57096 | No | No | - | - | Important | 7.8 | 6.8 |
| Windows Runtime Elevation of Privilege Vulnerability | |||||||
| CVE-2026-50323 | No | No | - | - | Important | 7.0 | 6.1 |
| CVE-2026-50452 | No | No | - | - | Important | 7.0 | 6.1 |
| CVE-2026-50348 | No | No | - | - | Important | 7.0 | 6.1 |
| CVE-2026-50345 | No | No | - | - | Important | 7.0 | 6.1 |
| CVE-2026-50322 | No | No | - | - | Important | 7.0 | 6.1 |
| CVE-2026-50340 | No | No | - | - | Important | 8.5 | 7.4 |
| CVE-2026-50410 | No | No | - | - | Important | 7.0 | 6.1 |
| CVE-2026-50449 | No | No | - | - | Important | 7.0 | 6.1 |
| CVE-2026-50460 | No | No | - | - | Important | 8.1 | 7.1 |
| CVE-2026-50403 | No | No | - | - | Important | 7.0 | 6.1 |
| CVE-2026-50385 | No | No | - | - | Important | 8.8 | 7.7 |
| CVE-2026-50413 | No | No | - | - | Important | 8.8 | 7.7 |
| CVE-2026-50457 | No | No | - | - | Important | 7.8 | 6.8 |
| CVE-2026-50486 | No | No | - | - | Important | 7.8 | 6.8 |
| CVE-2026-50503 | No | No | - | - | Important | 7.0 | 6.1 |
| CVE-2026-54125 | No | No | - | - | Important | 7.8 | 6.8 |
| CVE-2026-58527 | No | No | - | - | Important | 7.8 | 6.8 |
| Windows SMB Elevation of Privilege Vulnerability | |||||||
| CVE-2026-58531 | No | No | - | - | Important | 7.5 | 6.5 |
| Windows SMB Information Disclosure Vulnerability | |||||||
| CVE-2026-54997 | No | No | - | - | Important | 5.5 | 4.8 |
| CVE-2026-49801 | No | No | - | - | Important | 5.5 | 4.8 |
| CVE-2026-50690 | No | No | - | - | Important | 5.5 | 4.8 |
| Windows SMB Server Denial of Service Vulnerability | |||||||
| CVE-2026-56168 | No | No | - | - | Important | 6.5 | 5.7 |
| Windows SMB Server Elevation of Privilege Vulnerability | |||||||
| CVE-2026-50360 | No | No | - | - | Important | 8.8 | 7.7 |
| Windows SMB Server Network Transport Driver (srvnet.sys) Remote Code Execution Vulnerability | |||||||
| CVE-2026-57089 | No | No | - | - | Important | 7.5 | 6.5 |
| Windows Search Service Elevation of Privilege Vulnerability | |||||||
| CVE-2026-50373 | No | No | - | - | Important | 7.8 | 6.8 |
| CVE-2026-50679 | No | No | - | - | Important | 7.8 | 6.8 |
| Windows Secure Channel Denial of Service Vulnerability | |||||||
| CVE-2026-44806 | No | No | - | - | Important | 5.3 | 4.6 |
| Windows Secure Channel Information Disclosure Vulnerability | |||||||
| CVE-2026-50681 | No | No | - | - | Important | 5.5 | 4.8 |
| CVE-2026-56186 | No | No | - | - | Important | 8.1 | 7.1 |
| Windows Secure Kernel Mode Elevation of Privilege Vulnerability | |||||||
| CVE-2026-42982 | No | No | - | - | Critical | 7.8 | 6.8 |
| CVE-2026-50392 | No | No | - | - | Critical | 7.0 | 6.1 |
| Windows Secure Socket Tunneling Protocol (SSTP) Remote Code Execution Vulnerability | |||||||
| CVE-2026-50694 | No | No | - | - | Critical | 8.1 | 7.1 |
| Windows Sensor Data Service Elevation of Privilege Vulnerability | |||||||
| CVE-2026-50367 | No | No | - | - | Important | 7.8 | 6.8 |
| CVE-2026-58619 | No | No | - | - | Important | 7.0 | 6.1 |
| Windows Server Elevation of Privilege Vulnerability | |||||||
| CVE-2026-50311 | No | No | - | - | Important | 7.8 | 6.8 |
| Windows Server Network driver Remote Code Execution Vulnerability | |||||||
| CVE-2026-56188 | No | No | - | - | Critical | 9.8 | 8.5 |
| Windows Server Update Service (WSUS) Elevation of Privilege Vulnerability | |||||||
| CVE-2026-50444 | No | No | - | - | Critical | 8.8 | 7.7 |
| Windows Server Update Service (WSUS) Tampering Vulnerability | |||||||
| CVE-2026-50328 | No | No | - | - | Important | 7.5 | 6.5 |
| Windows Spaceport.sys Elevation of Privilege Vulnerability | |||||||
| CVE-2026-50333 | No | No | - | - | Important | 7.8 | 6.8 |
| CVE-2026-50298 | No | No | - | - | Important | 6.8 | 5.9 |
| Windows Speech Runtime Elevation of Privilege Vulnerability | |||||||
| CVE-2026-49171 | No | No | - | - | Important | 7.5 | 6.5 |
| Windows StateRepository API Server file Elevation of Privilege Vulnerability | |||||||
| CVE-2026-49170 | No | No | - | - | Important | 7.8 | 6.8 |
| Windows Storage Elevation of Privilege Vulnerability | |||||||
| CVE-2026-58526 | No | No | - | - | Important | 7.0 | 6.1 |
| Windows Storage Spaces Direct Remote Code Execution Vulnerability | |||||||
| CVE-2026-50299 | No | No | - | - | Important | 6.8 | 5.9 |
| Windows Subsystem for Linux (WSL2) Kernel Elevation of Privilege Vulnerability | |||||||
| CVE-2026-57968 | No | No | - | - | Important | 7.8 | 6.8 |
| Windows Subsystem for Linux (WSL2) Kernel Tampering Vulnerability | |||||||
| CVE-2026-57973 | No | No | - | - | Important | 6.3 | 5.5 |
| Windows System Secure Feature Bypass Vulnerability | |||||||
| CVE-2026-50418 | No | No | - | - | Important | 5.1 | 4.5 |
| Windows TCP/IP Elevation of Privilege Vulnerability | |||||||
| CVE-2026-50306 | No | No | - | - | Important | 7.8 | 6.8 |
| CVE-2026-50307 | No | No | - | - | Important | 7.0 | 6.1 |
| Windows TCP/IP Information Disclosure Vulnerability | |||||||
| CVE-2026-49177 | No | No | - | - | Important | 5.5 | 4.8 |
| Windows TCP/IP Remote Code Execution Vulnerability | |||||||
| CVE-2026-54999 | No | No | - | - | Critical | 8.8 | 7.7 |
| Windows Telephony Server Elevation of Privilege Vulnerability | |||||||
| CVE-2026-50669 | No | No | - | - | Important | 7.0 | 6.1 |
| Windows Terminal Remote Code Execution Vulnerability | |||||||
| CVE-2026-54124 | No | No | - | - | Important | 7.8 | 6.8 |
| Windows Trusted Runtime Interface Driver Information Disclosure Vulnerability | |||||||
| CVE-2026-50350 | No | No | - | - | Important | 5.5 | 4.8 |
| Windows USB Audio Class Driver Information Disclosure Vulnerability | |||||||
| CVE-2026-49794 | No | No | - | - | Important | 4.6 | 4.0 |
| CVE-2026-50453 | No | No | - | - | Important | 6.1 | 5.3 |
| CVE-2026-58528 | No | No | - | - | Important | 6.8 | 5.9 |
| Windows USB Driver Elevation of Privilege Vulnerability | |||||||
| CVE-2026-50321 | No | No | - | - | Important | 7.8 | 6.8 |
| Windows USB Hub Driver Elevation of Privilege Vulnerability | |||||||
| CVE-2026-50479 | No | No | - | - | Important | 7.8 | 6.8 |
| Windows USB Print Driver Elevation of Privilege Vulnerability | |||||||
| CVE-2026-55000 | No | No | - | - | Important | 6.4 | 5.6 |
| CVE-2026-54991 | No | No | - | - | Important | 7.8 | 6.8 |
| CVE-2026-54996 | No | No | - | - | Important | 7.0 | 6.1 |
| CVE-2026-49802 | No | No | - | - | Important | 7.0 | 6.1 |
| CVE-2026-49806 | No | No | - | - | Important | 7.0 | 6.1 |
| CVE-2026-50674 | No | No | - | - | Important | 7.0 | 6.1 |
| Windows USB Video Driver Elevation of Privilege Vulnerability | |||||||
| CVE-2026-49804 | No | No | - | - | Important | 6.6 | 5.8 |
| Windows Unified Consent System Elevation of Privilege Vulnerability | |||||||
| CVE-2026-50326 | No | No | - | - | Important | 7.8 | 6.8 |
| Windows Universal Disk Format File System Driver (UDFS) Elevation of Privilege Vulnerability | |||||||
| CVE-2026-49790 | No | No | - | - | Important | 7.3 | 6.4 |
| CVE-2026-50498 | No | No | - | - | Important | 7.8 | 6.8 |
| Windows Universal Plug and Play (UPnP) Device Host Elevation of Privilege Vulnerability | |||||||
| CVE-2026-58547 | No | No | - | - | Important | 5.5 | 4.8 |
| Windows User Interface Core Elevation of Privilege Vulnerability | |||||||
| CVE-2026-50454 | No | No | - | - | Important | 7.8 | 6.8 |
| Windows WalletService Elevation of Privilege Vulnerability | |||||||
| CVE-2026-49176 | No | No | - | - | Important | 7.8 | 6.8 |
| Windows Web Proxy Auto-Discovery Protocol (WPAD) Elevation of Privilege Vulnerability | |||||||
| CVE-2026-49800 | No | No | - | - | Important | 7.8 | 6.8 |
| CVE-2026-50480 | No | No | - | - | Important | 7.8 | 6.8 |
| Windows WebView Elevation of Privilege Vulnerability | |||||||
| CVE-2026-56173 | No | No | - | - | Important | 7.0 | 6.1 |
| Windows Win32 Kernel Subsystem Elevation of Privilege Vulnerability | |||||||
| CVE-2026-58632 | No | No | - | - | Important | 7.8 | 6.8 |
| Windows Win32k Elevation of Privilege Vulnerability | |||||||
| CVE-2026-54107 | No | No | - | - | Important | 8.8 | 7.7 |
| CVE-2026-54986 | No | No | - | - | Important | 7.8 | 6.8 |
| CVE-2026-54112 | No | No | - | - | Important | 7.8 | 6.8 |
| CVE-2026-54114 | No | No | - | - | Important | 7.8 | 6.8 |
| CVE-2026-50670 | No | No | - | - | Important | 8.8 | 7.7 |
| CVE-2026-50688 | No | No | - | - | Important | 7.8 | 6.8 |
| CVE-2026-50687 | No | No | - | - | Important | 8.8 | 7.7 |
| CVE-2026-56176 | No | No | - | - | Important | 7.8 | 6.8 |
| Windows Wireless Network Manager Elevation of Privilege Vulnerability | |||||||
| CVE-2026-58628 | No | No | - | - | Important | 7.8 | 6.8 |
| Windows Zero Trust DNS Security Feature Bypass Vulnerability | |||||||
| CVE-2026-50295 | No | No | - | - | Important | 5.5 | 4.8 |
| Wireless Wide Area Network Service (WwanSvc) Elevation of Privilege Vulnerability | |||||||
| CVE-2026-50509 | No | No | - | - | Important | 7.8 | 6.8 |
--
Johannes B. Ullrich, Ph.D. , Dean of Research, SANS.edu
Twitter|


Comments